Reporting to Governors: getting started
 Updated
Are you a headteacher or senior leader who spends too much time preparing data for governors’ meetings? It’s a common problem. But don’t worry, Insight is here to help. With a few clicks you can create visually engaging and information-packed reports that will quickly spark discussion.
There are several reports that are of use for governors, from simple Attainment Overviews, which give a summary of the latest assessments, to the Statutory Assessments report, which provides an in-depth analysis of the results EYFSP, phonics, KS1, MTC and KS2 assessments. The Attendance report is also vital for governors. Perhaps the most useful tool is the Headlines report, which can pull together a lot of different data and present in various ways. All the reports shown in this help guide are available from the Reports menu.
Present an overview
Insight overviews are ideal tools for presenting a picture of attainment and progress across the school. Quickly compare the performance of cohorts and pupil groups in all subjects using any data you like. Overviews help identify key areas of concern, enabling governors to ask informed questions and effectively monitor standards. Attainment overviews include Venn diagrams, which are especially useful for revealing inconsistencies across subjects.
The Venn diagrams compare the selected subjects assessments only, not contextual groups.
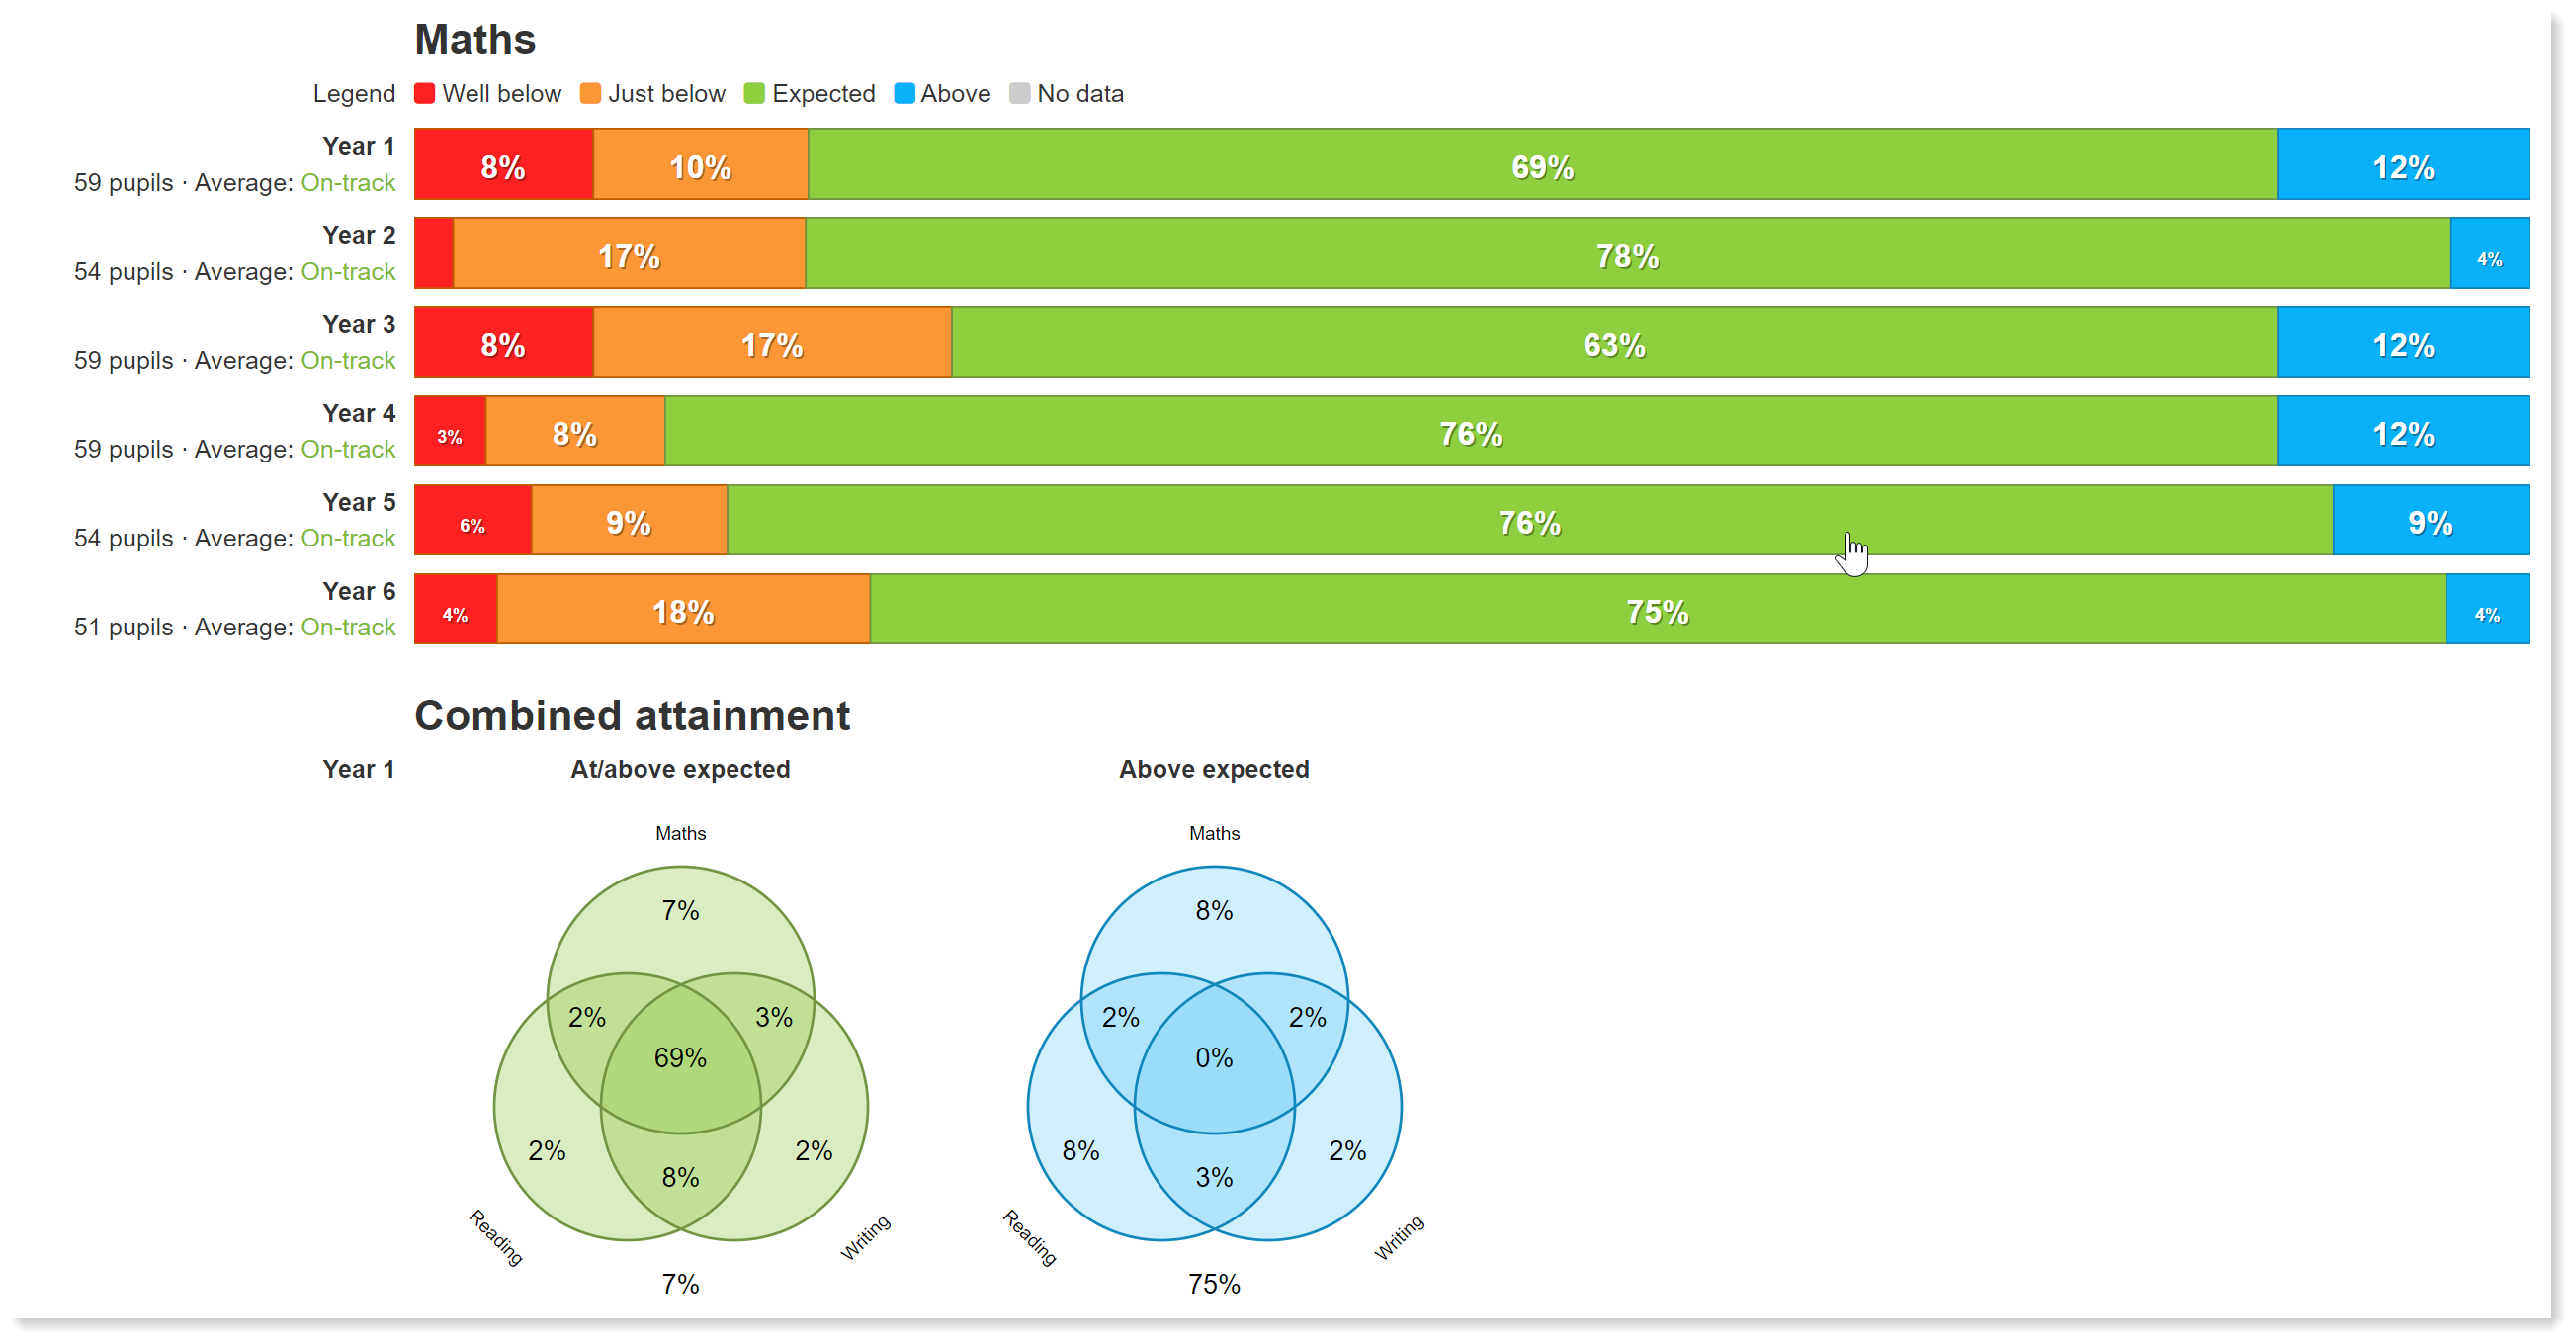
Overview of attainment: select all year groups and group by year group
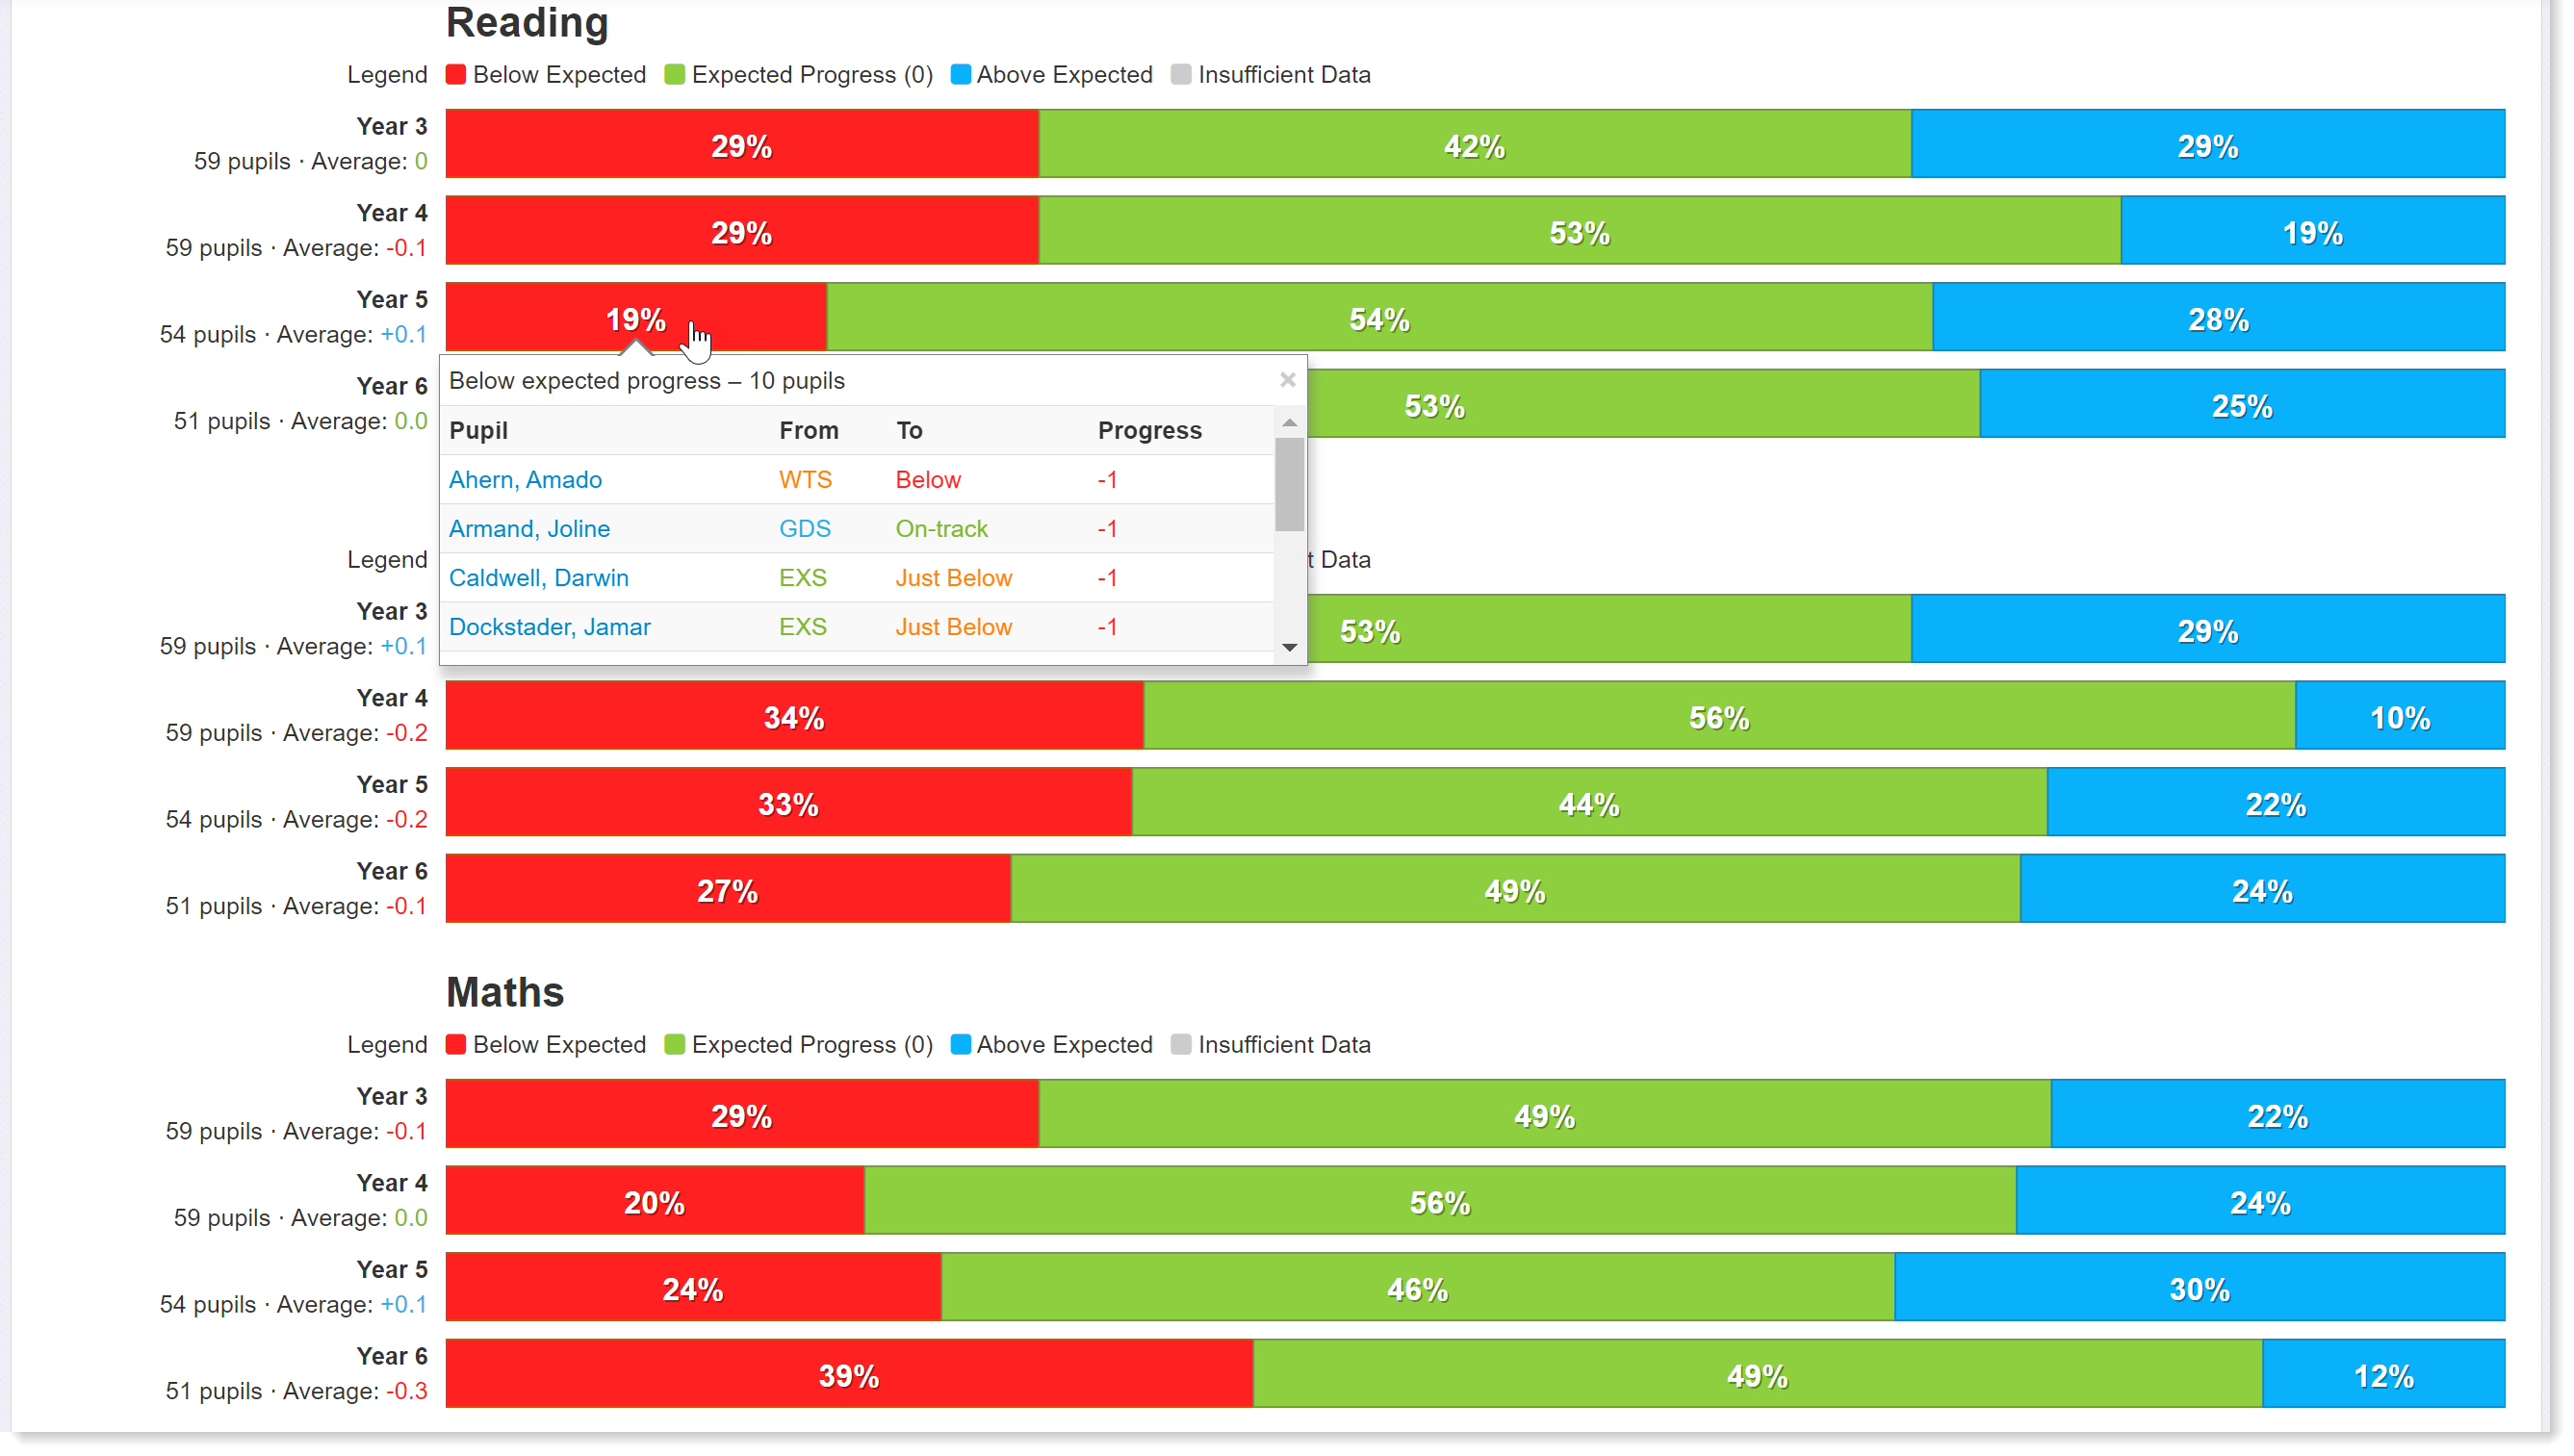
Overview of progress: select year 3 to 6 and show progress from KS1 to latest assessment
Build a table
Insight Tables are powerful reports that can pull all your data into one place. Add columns of assessment data to your table and summarise it at the click of a button to provide your governors with averages for subjects, cohorts and key groups of pupils. Use assessment comparison columns to generate percentages of pupils working at or above expectations over time and insert progress columns to show the change in average score or reading age between assessment points. You can even use a table to monitor the effectiveness of interventions for pupils with special educational needs.
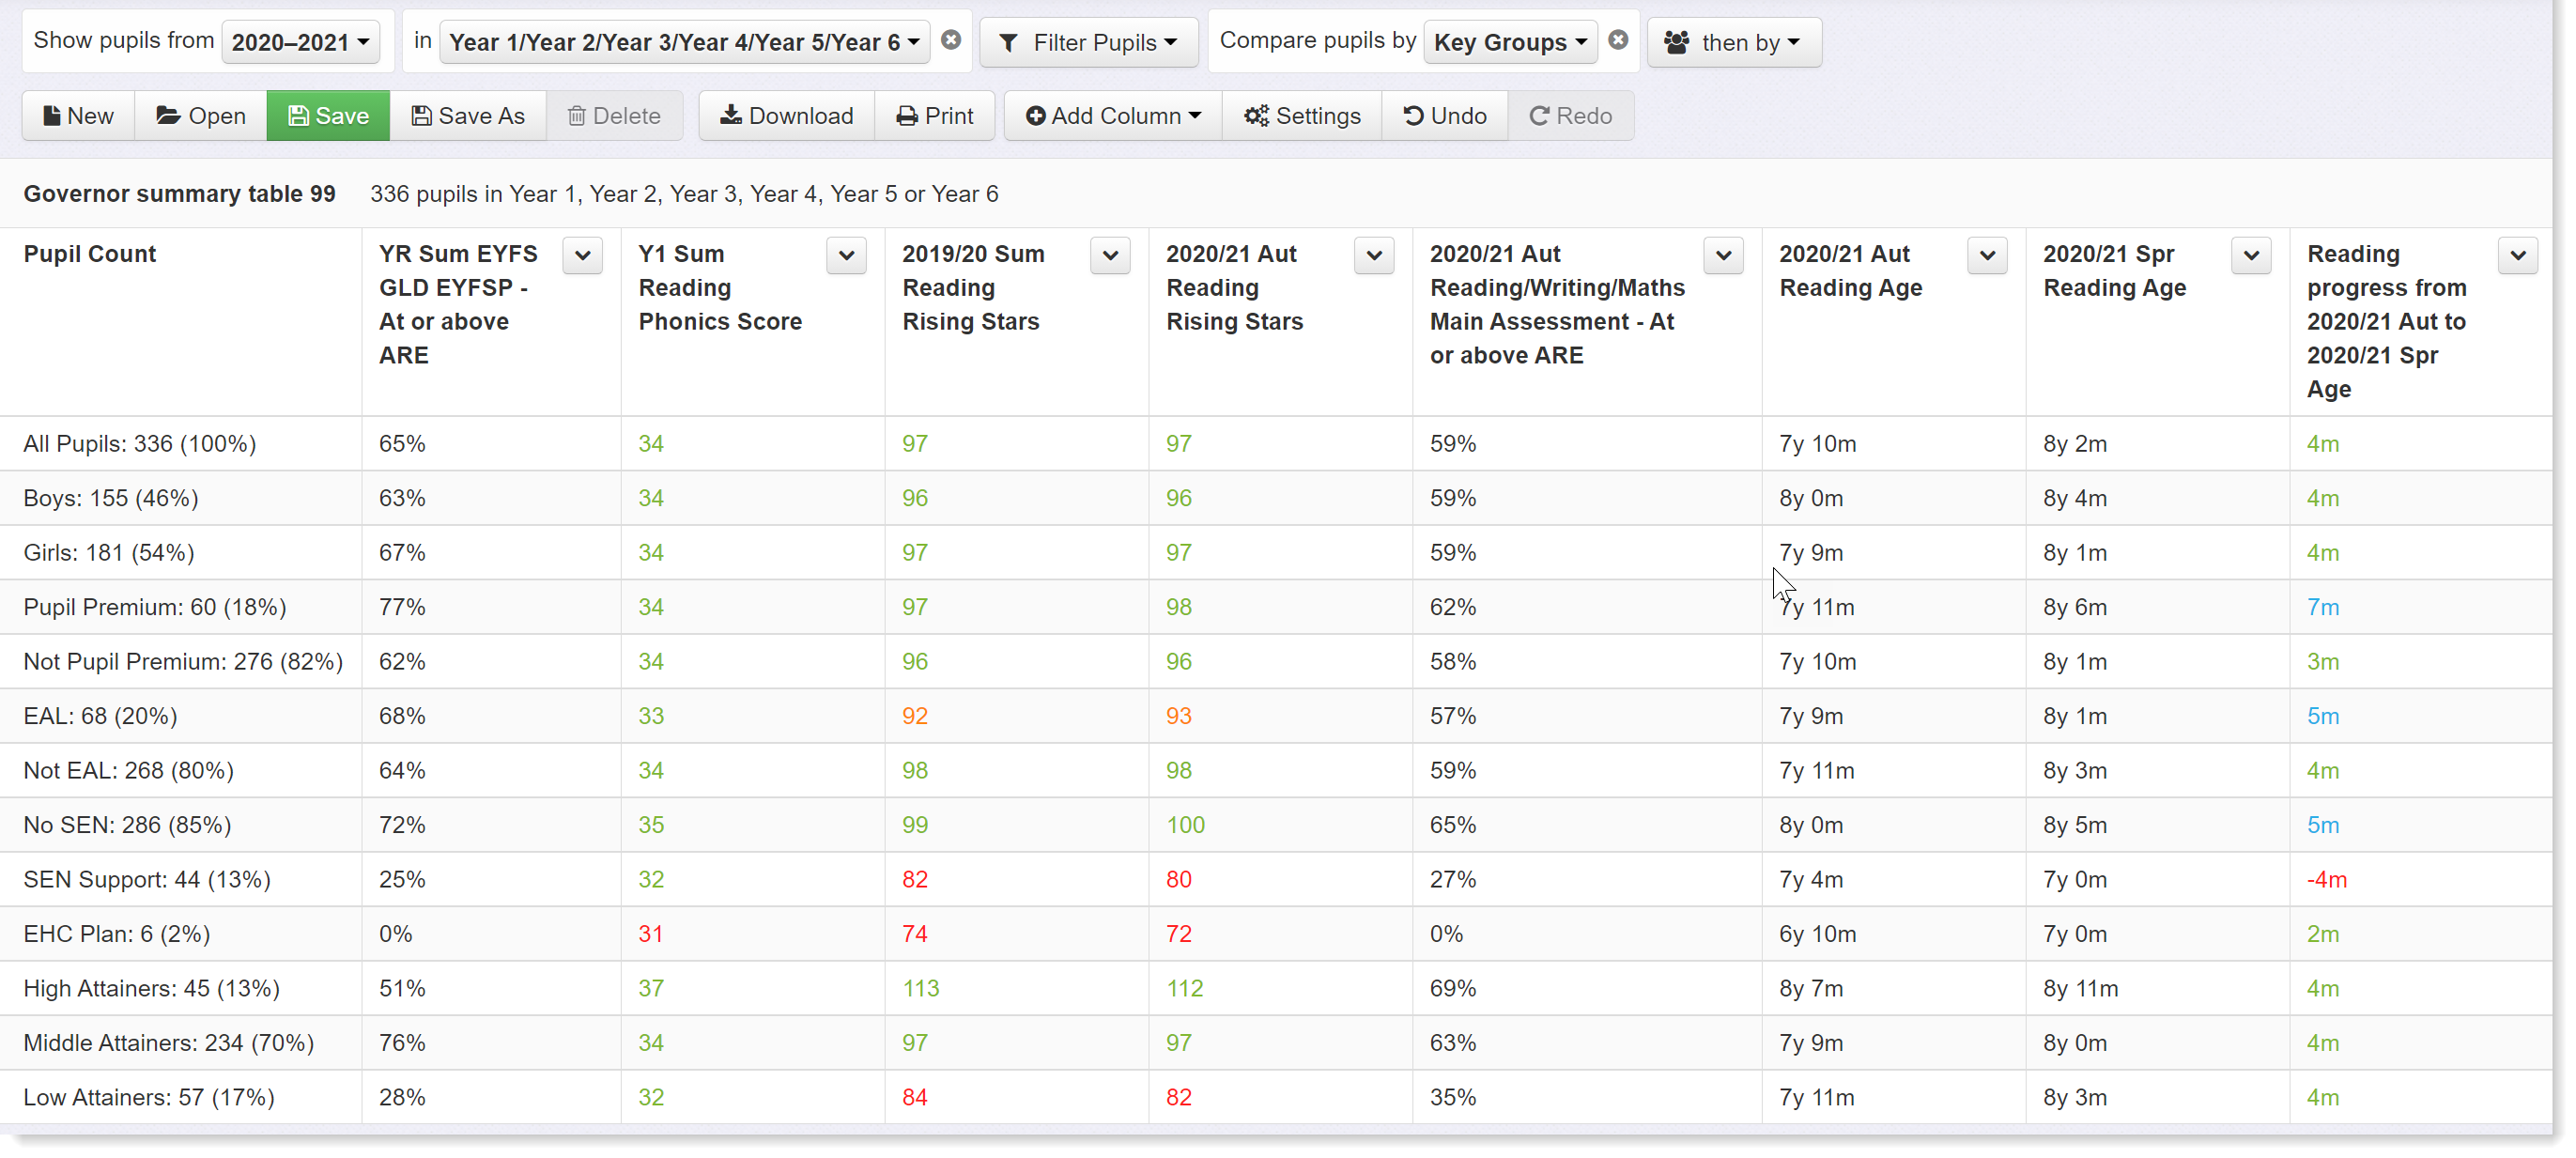
Table report: columns show percentages at or above expectations at key points, average scores and reading age, and change in reading age, broken down by key group.
Combine all your data into a Headlines report
Headlines reports are perfect for Governors. You can get all your key data on one page! Add columns of percentages and average scores alongside attainment and progress overview bars to create the complete solution. Break the data down by subject, cohort, and pupil group in whatever order you like, and quickly reorganise the structure of your report to get the best layout. You can even build a report in advance that will automatically populate as results are entered into the system throughout the year. And you’ll never have to worry about inaccuracies because it will always refresh to take account of changes. Headlines is an extremely powerful tool that will save you hours.
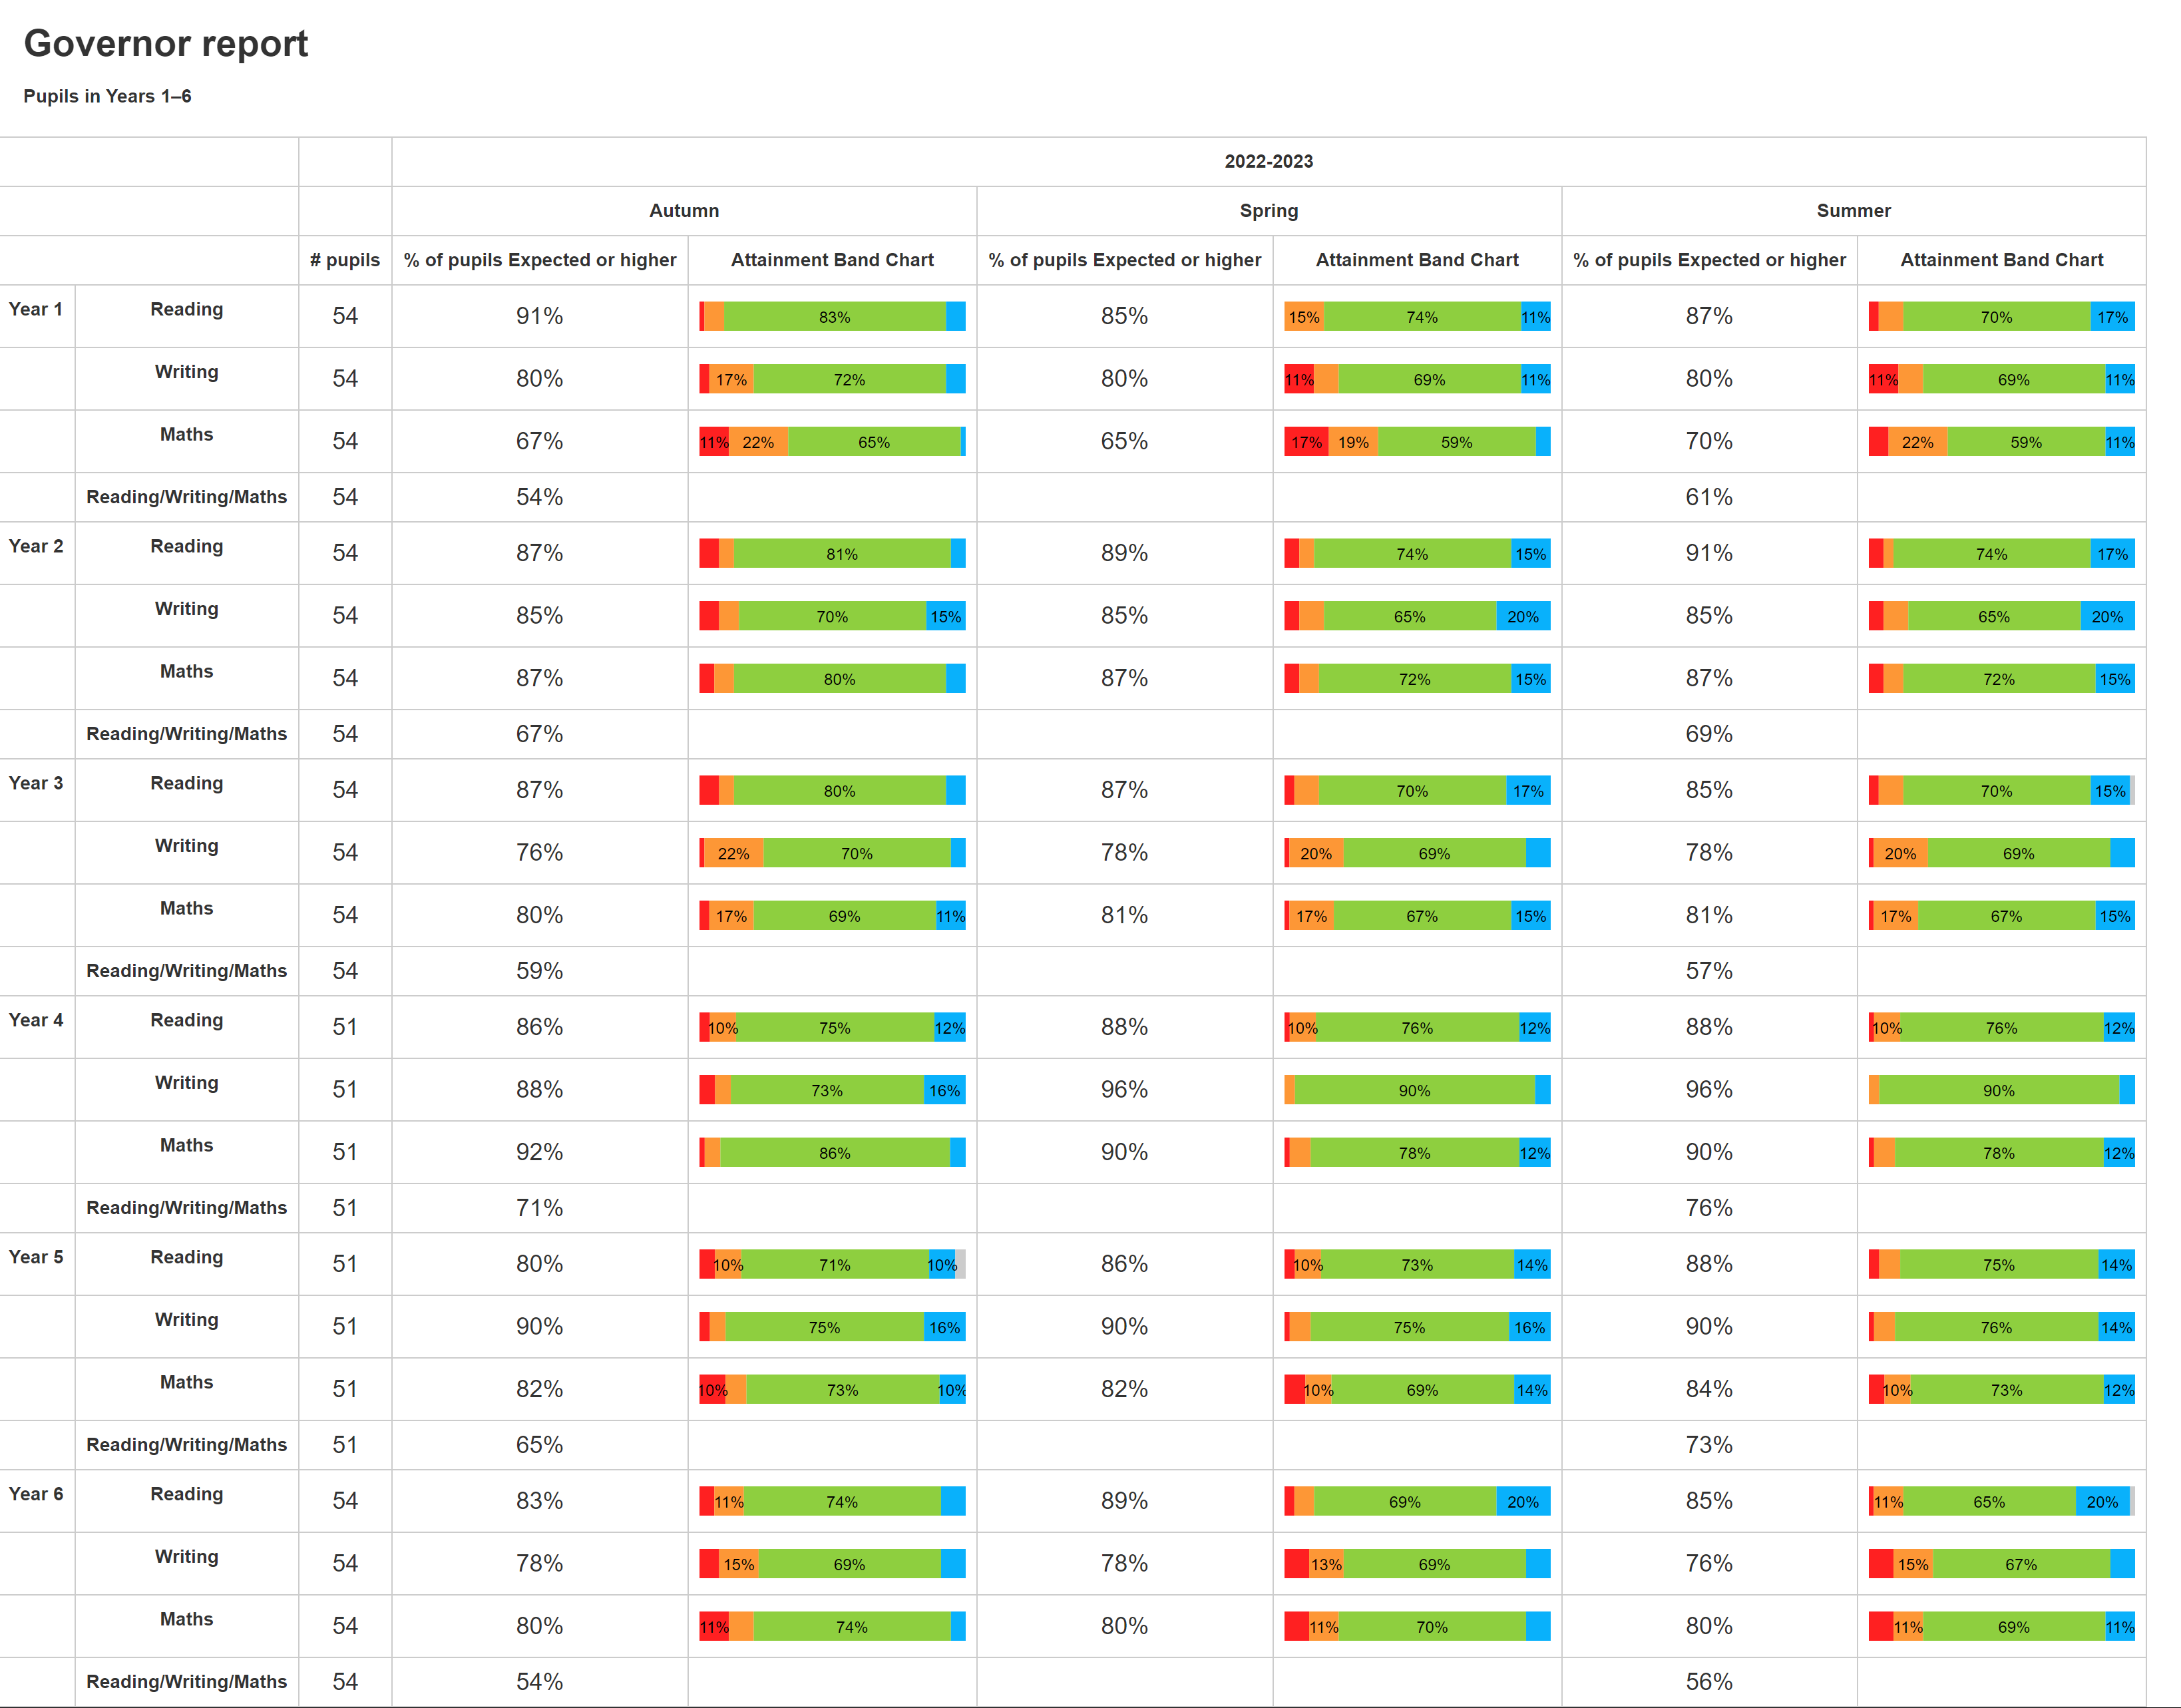
Headlines report: columns for different terms showing percentages at or above expectations in each year group and subject, including combined subjects, alongside attainment overview bars for more detail.
Don’t forget Progress Matrices
Progress matrices are brilliant for teachers monitoring the progress of pupils between assessment points, but did you know you can show them to governors, too? Simply opt to remove pupil names and the matrix is instantly summarised to show the numbers and percentages of pupils in each cell. Governors can then see how the latest round of assessments compares to prior attainment and enquire about catch up strategies for those that have fallen behind.
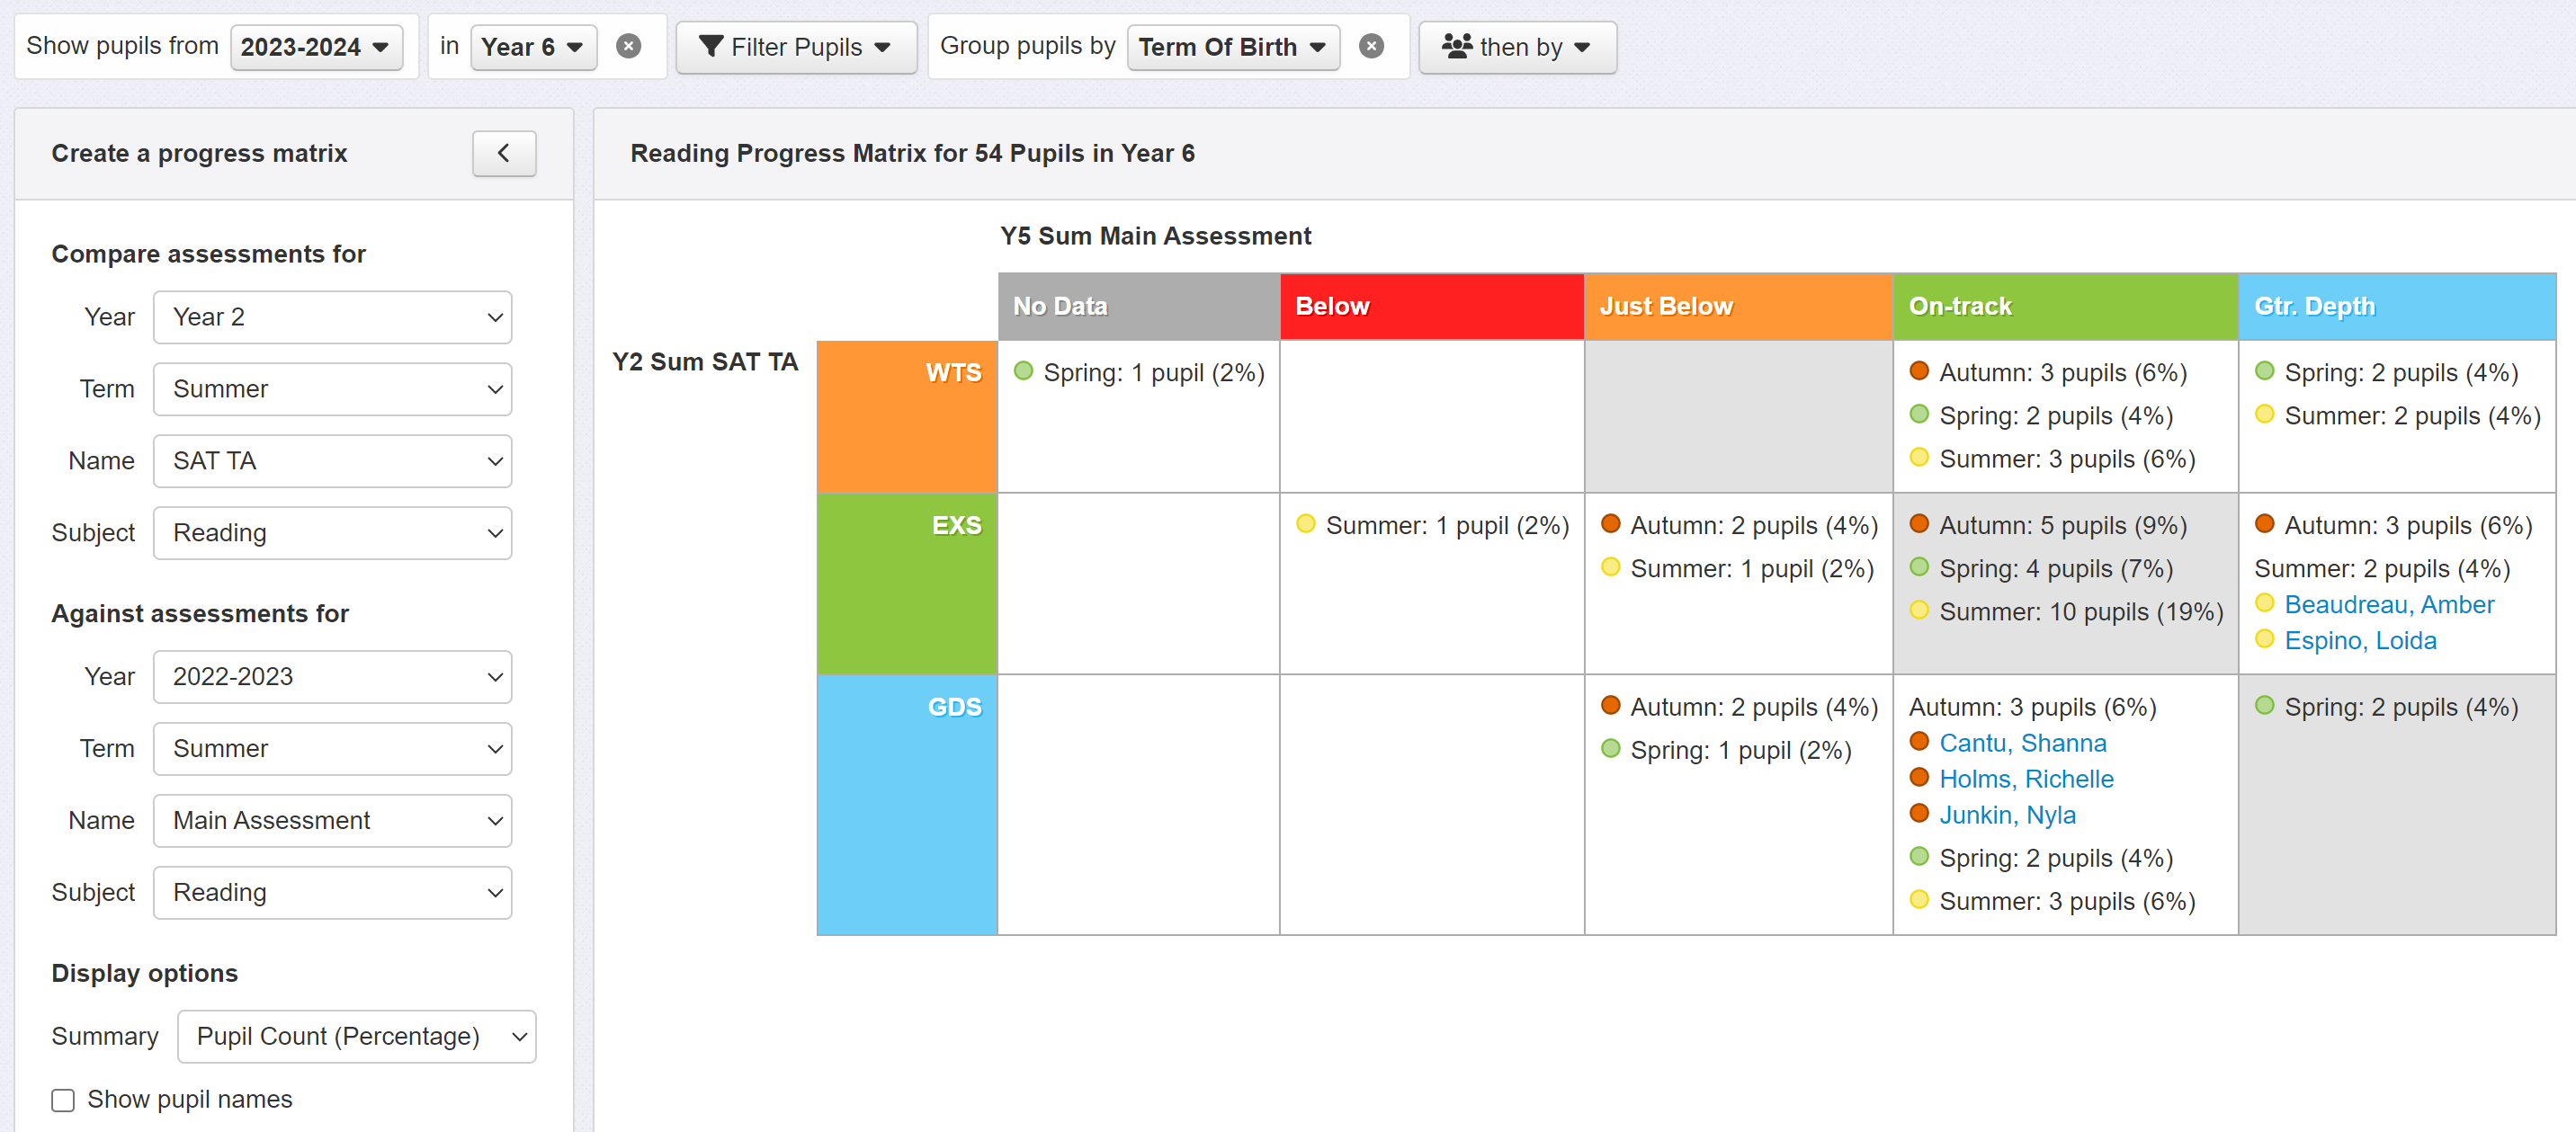
Progress matrix: compares latest assessments for year 6 to KS1 results. Data is grouped by term of birth.
and finally...
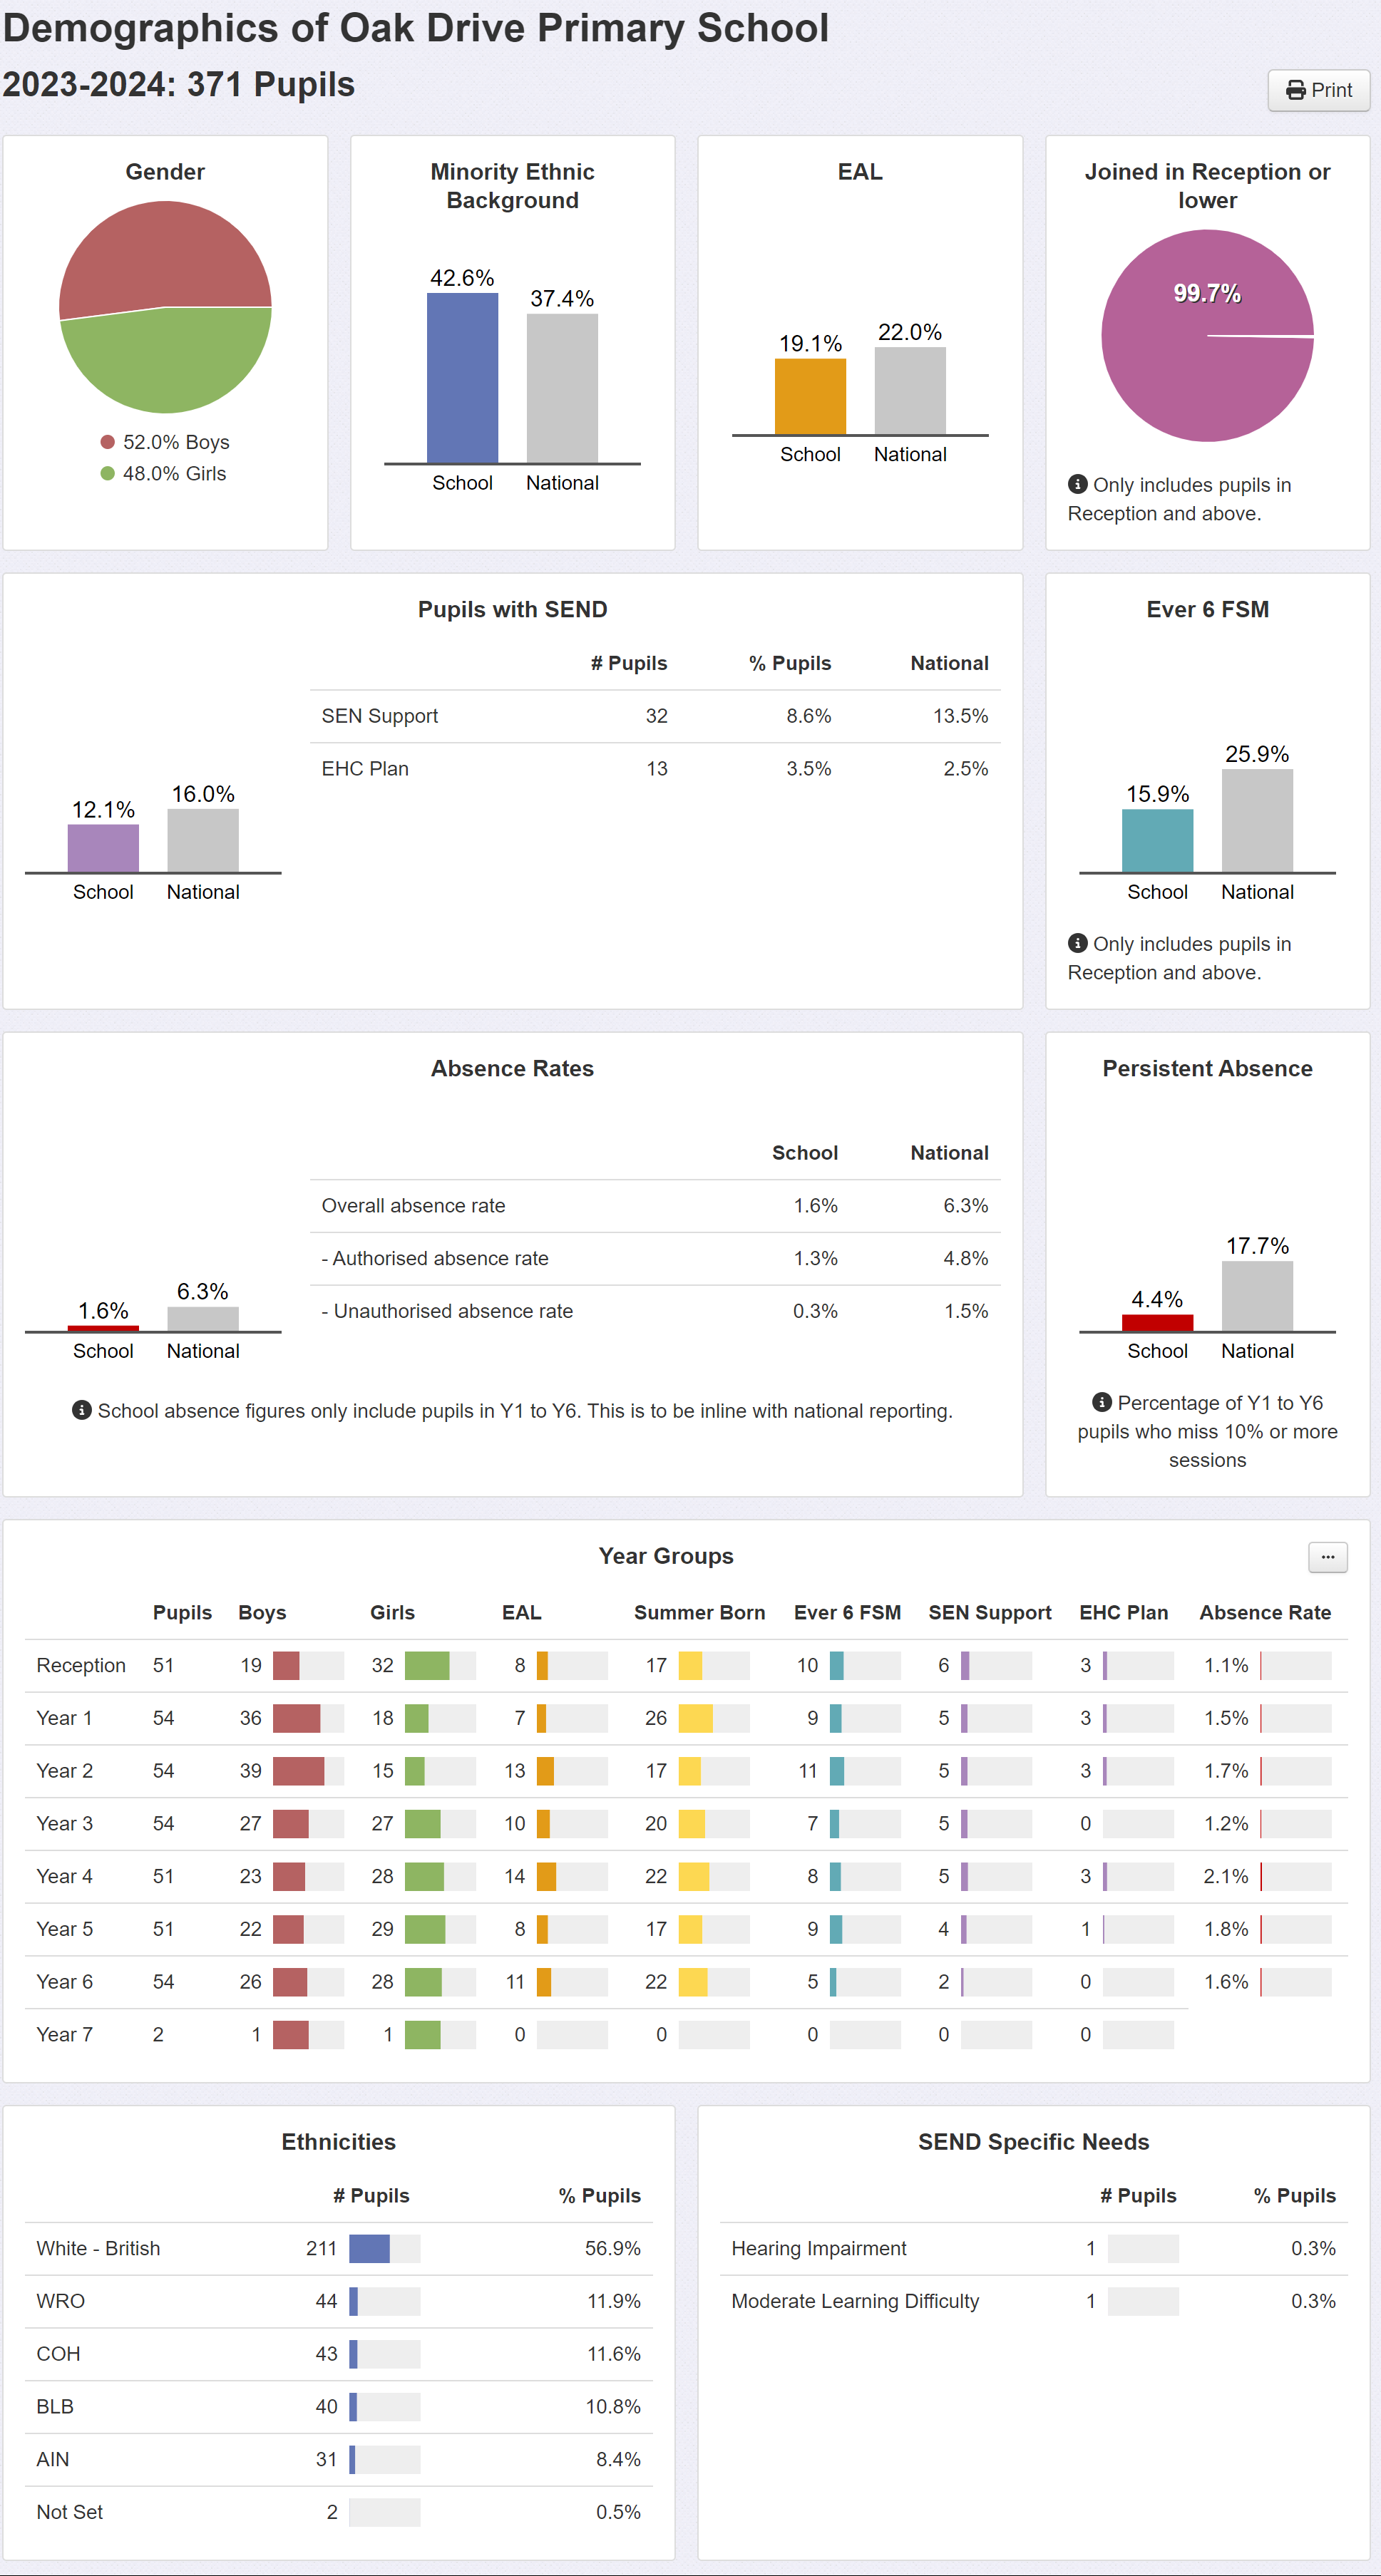
Insight's demographics report provides a useful summary of the school population...
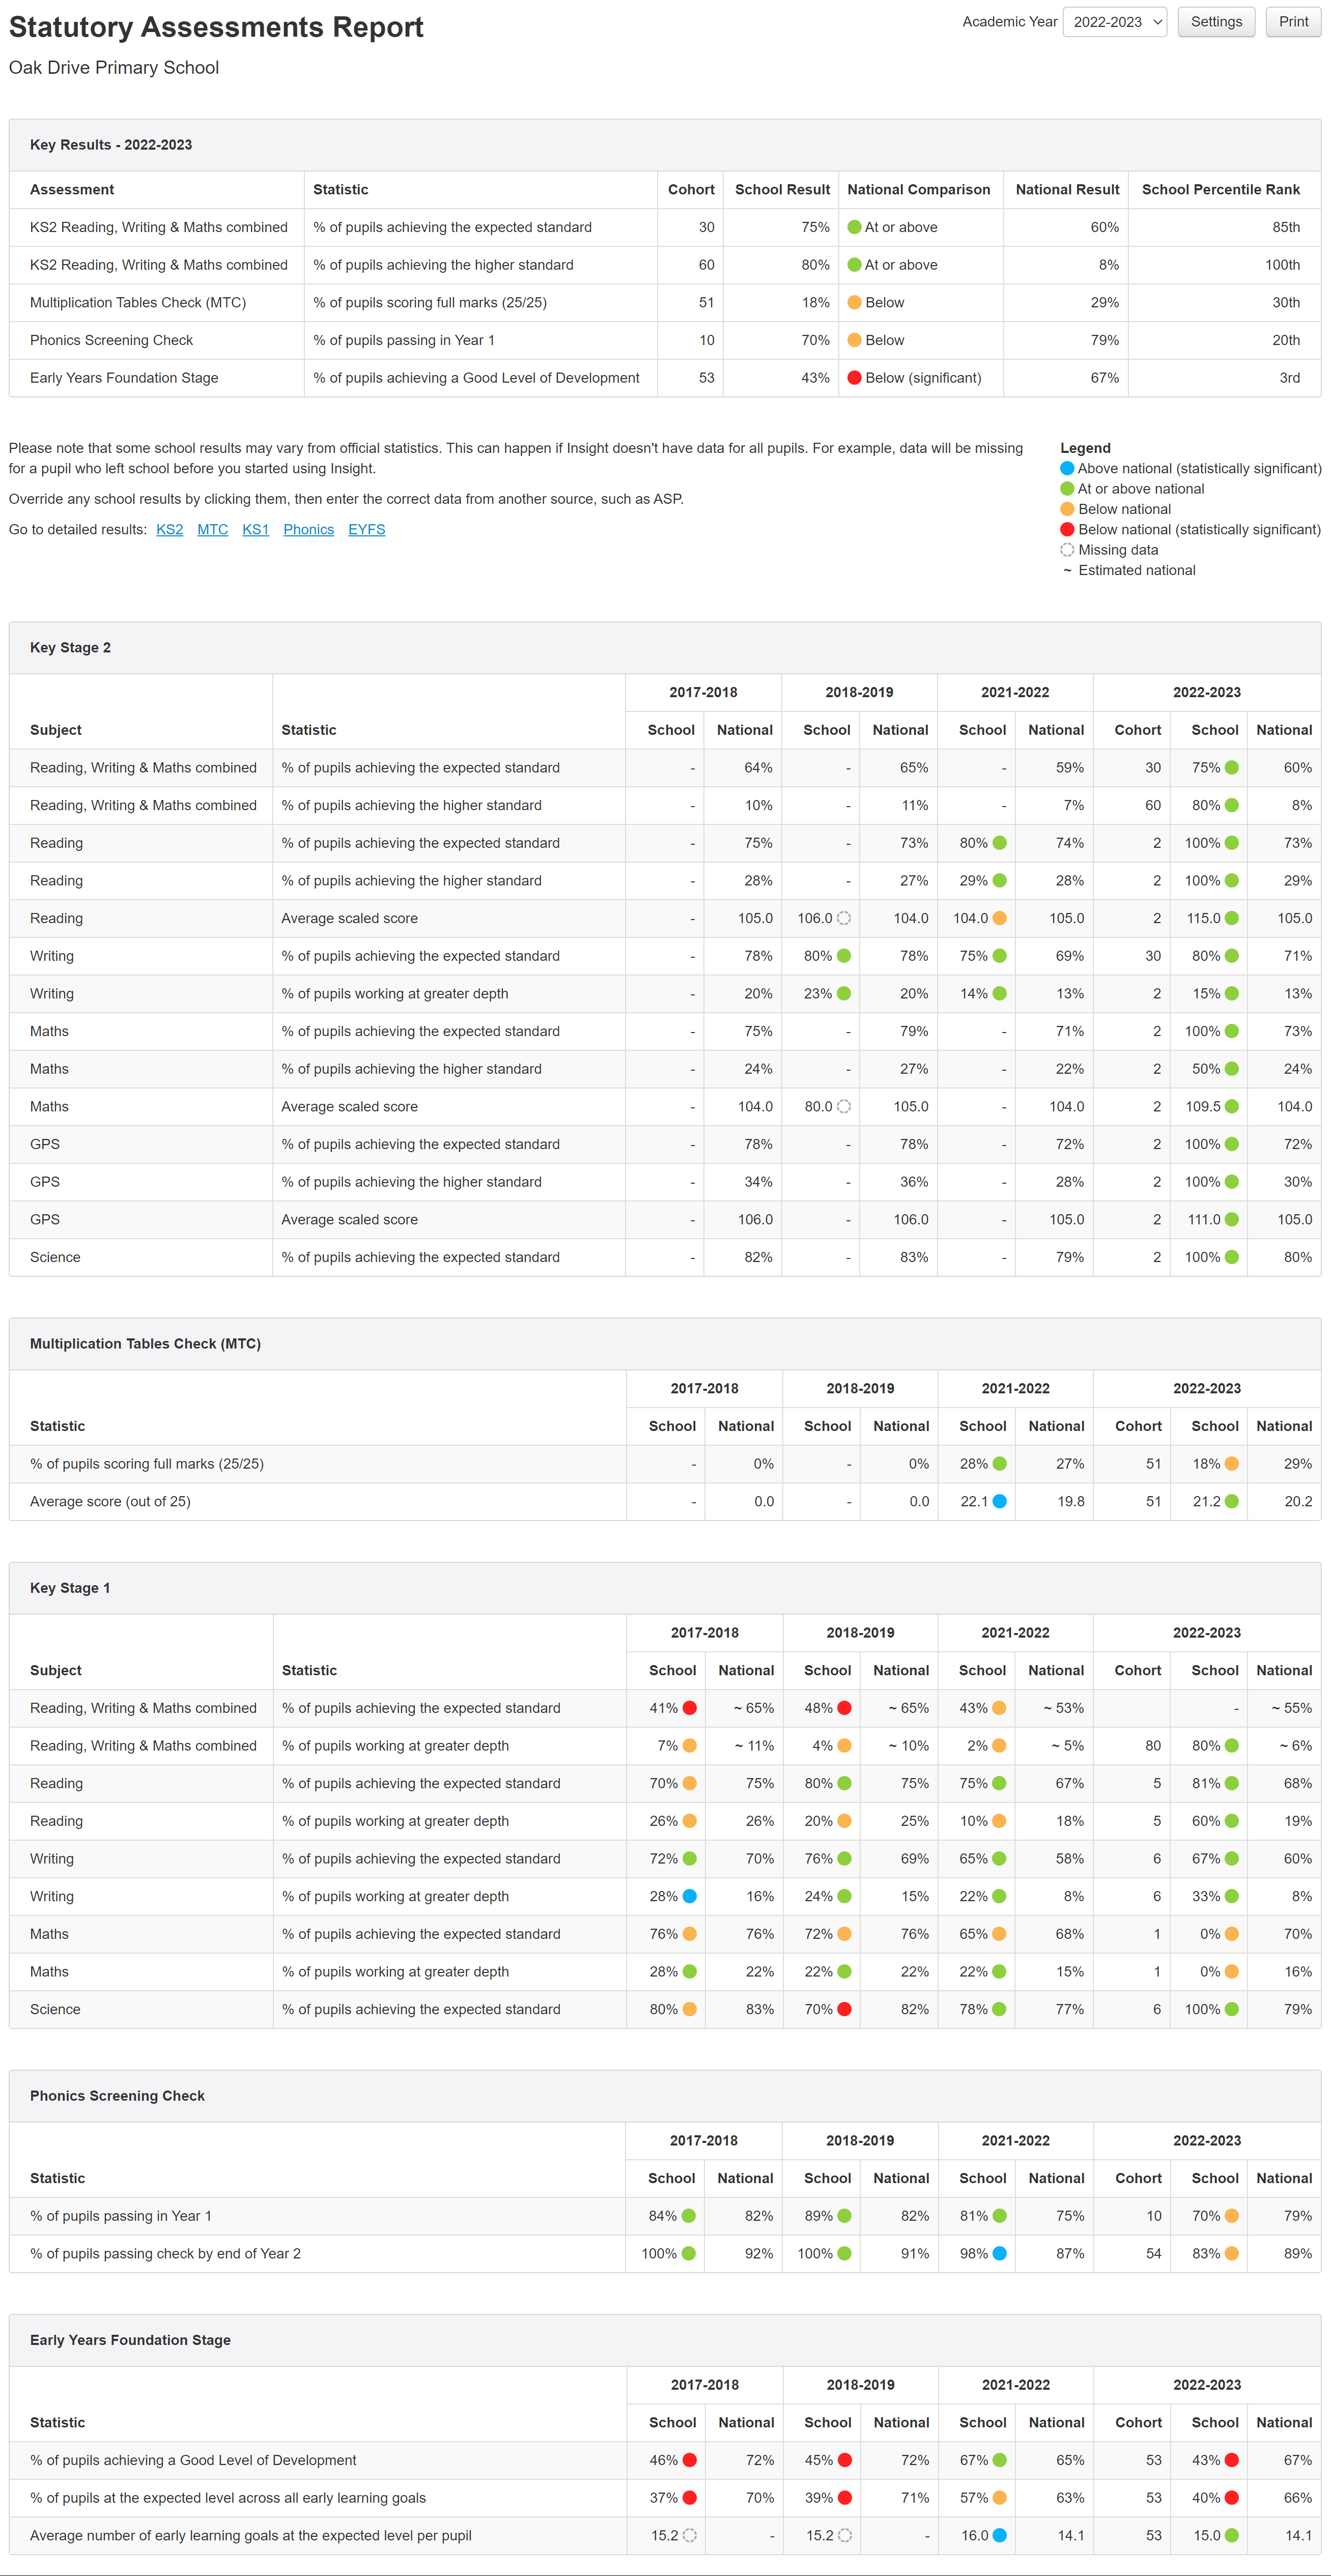
and the statutory assessment report shows results over 4 years (for those years when statutory assessment happens).
If you need to produce clear and simple reports quickly for your governors, then Insight’s suite of intuitive and interactive tools will help make your life easier. Please check out our detailed help guides for more information or get in touch if you need any help.
Further Reading
From the Insight Inform blog: What data do Governors need?
From the Insight Inform podcast: Data for Governors