Tables report - Introduction
 Updated
- Selecting and grouping pupils
- Adding Pupil Info Columns
- Adding Assessment Columns
- Adding Assessment Comparison Columns
- Adding Progress Columns
- Adding Target Met Columns
- Adding Attendance Columns
- Adding Learning Barrier columns
- Adding Learning Plan Columns
- Adding Provisions Columns
- Removing pupil names
- Loading reports
- Downloading your Table
The Tables report is a true workhorse. It may not have the visuals of other reports in Insight but it is extremely powerful. If you've ever had to run numerous reports, looking for various figures, which you then compile in your own table template or spreadsheet, then Tables is going to save you a lot of pain and effort. Tables allows you to pull all of your data - demographics, attendance, attainment and progress - into one place.
For Trust users, there is also a Tables report enabling data comparison across all the schools in the Trust.
Other help guides on inserting assessment comparison and progress columns, which will add an extra dimension to your tables, are also available.
In this help guide, we're going to work through the options and build a basic report.
Selecting and grouping pupils
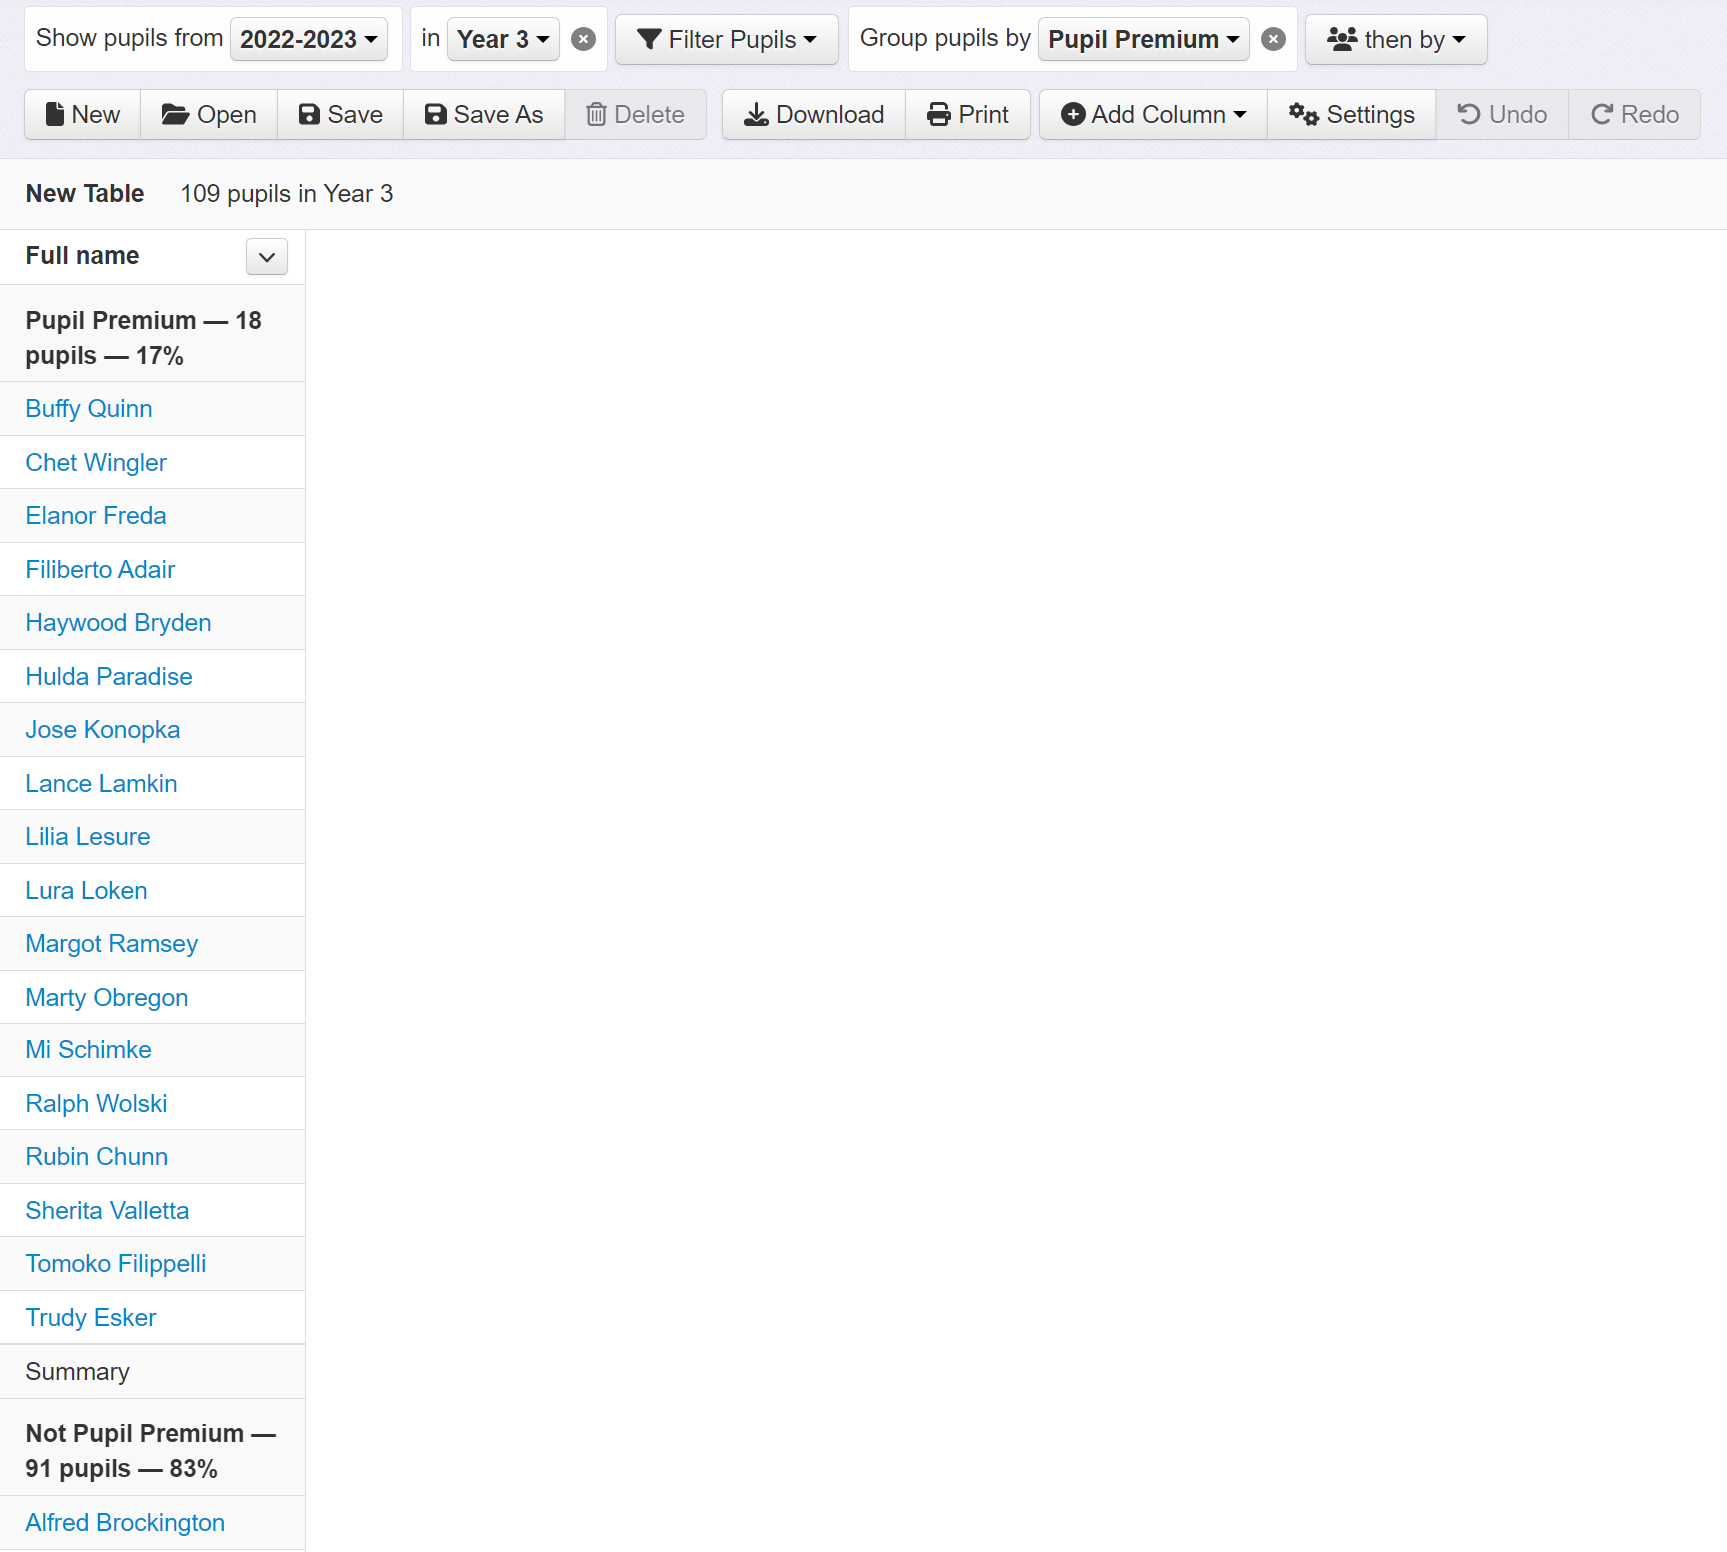
When you first open Tables, you will be presented with a list of names in column 1. This will be the cohort you were looking at last time you ran a report. You can easily change the pupils by using the filters and groups at the top of the screen.
Filter Pupils will restrict the pupils to those defined by the filter.
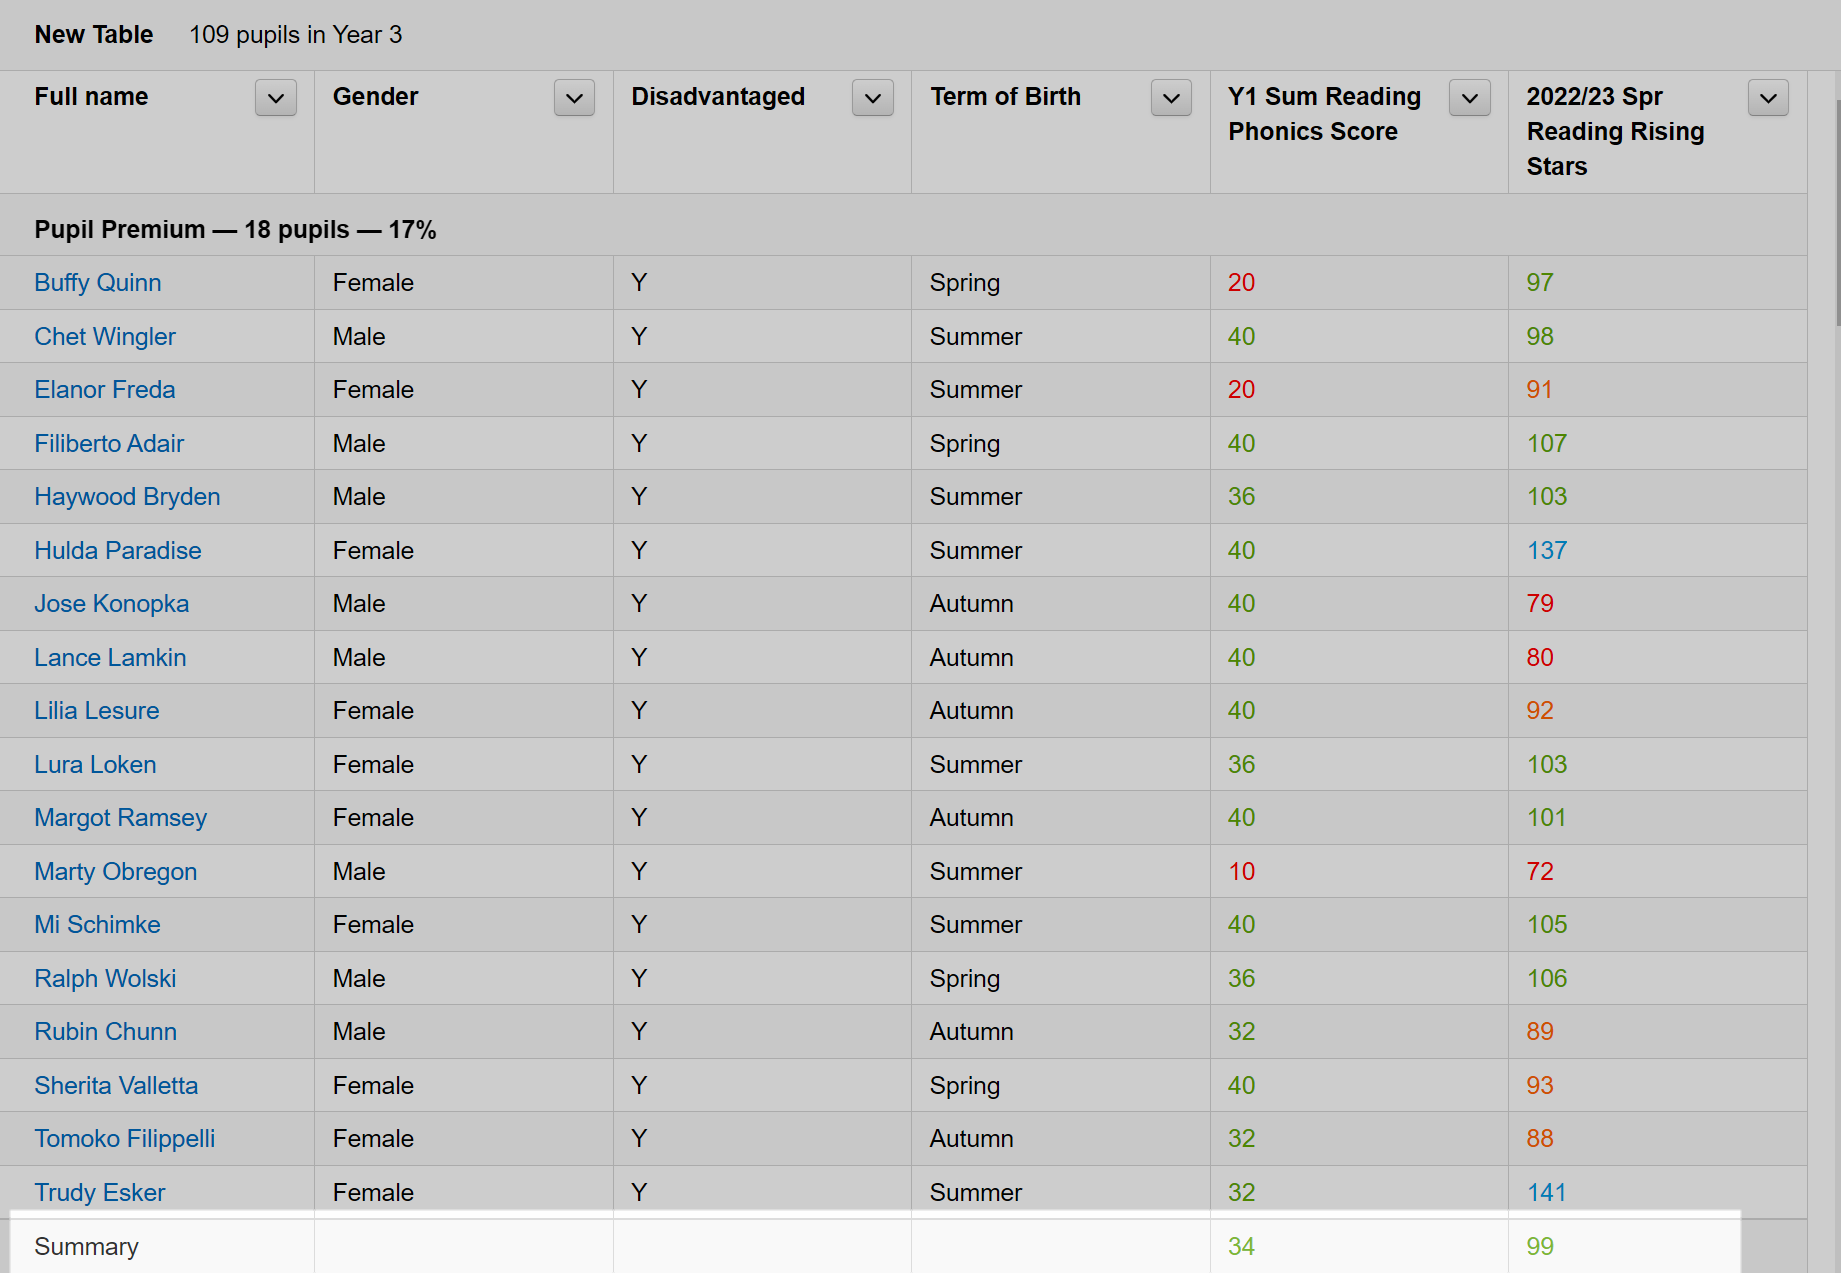
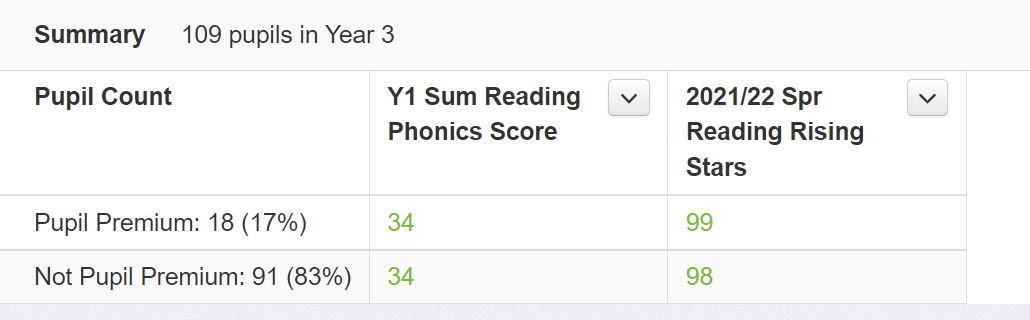
Group Pupils will group specified pupils together and show a summary row for each group. The following table shows Year 3 pupils grouped by Pupil Premium eligibility.
If you're using the Trust version of the Table report, you will have the option to group by School.
Adding Pupil Info Columns
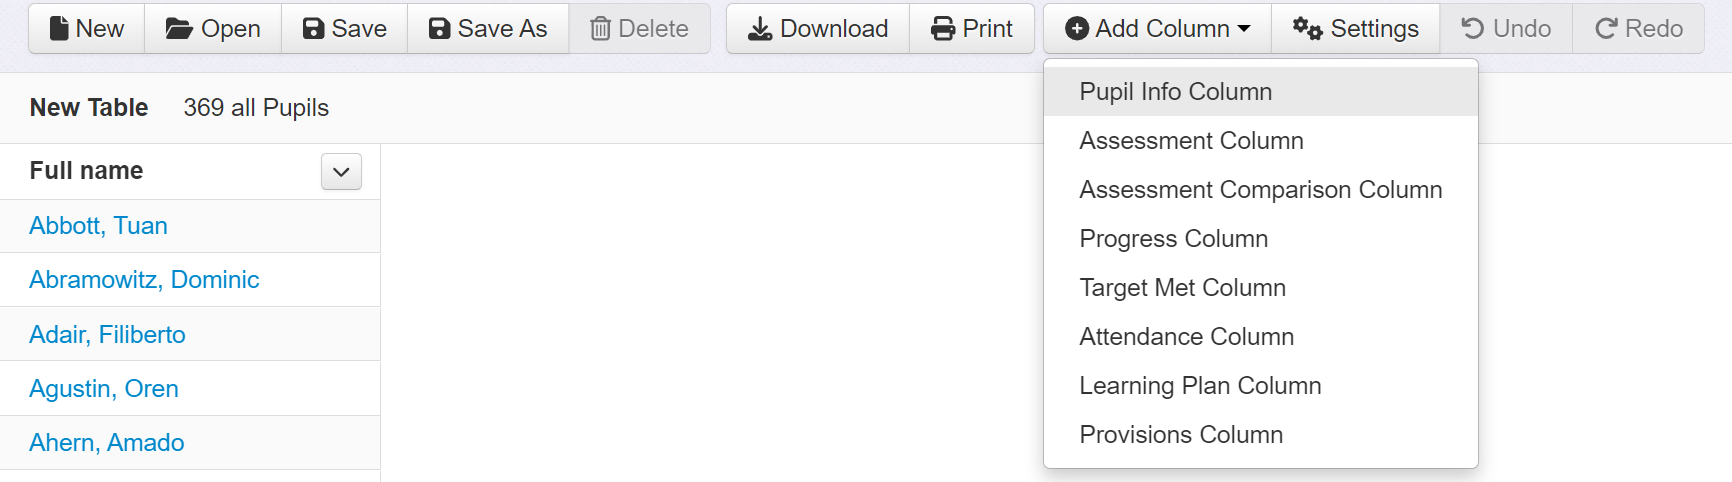
Pupil Info Columns, as the name suggests, adds demographic and contextual data to the Table. Click the Add Column button and select Pupil Info Column from the list.
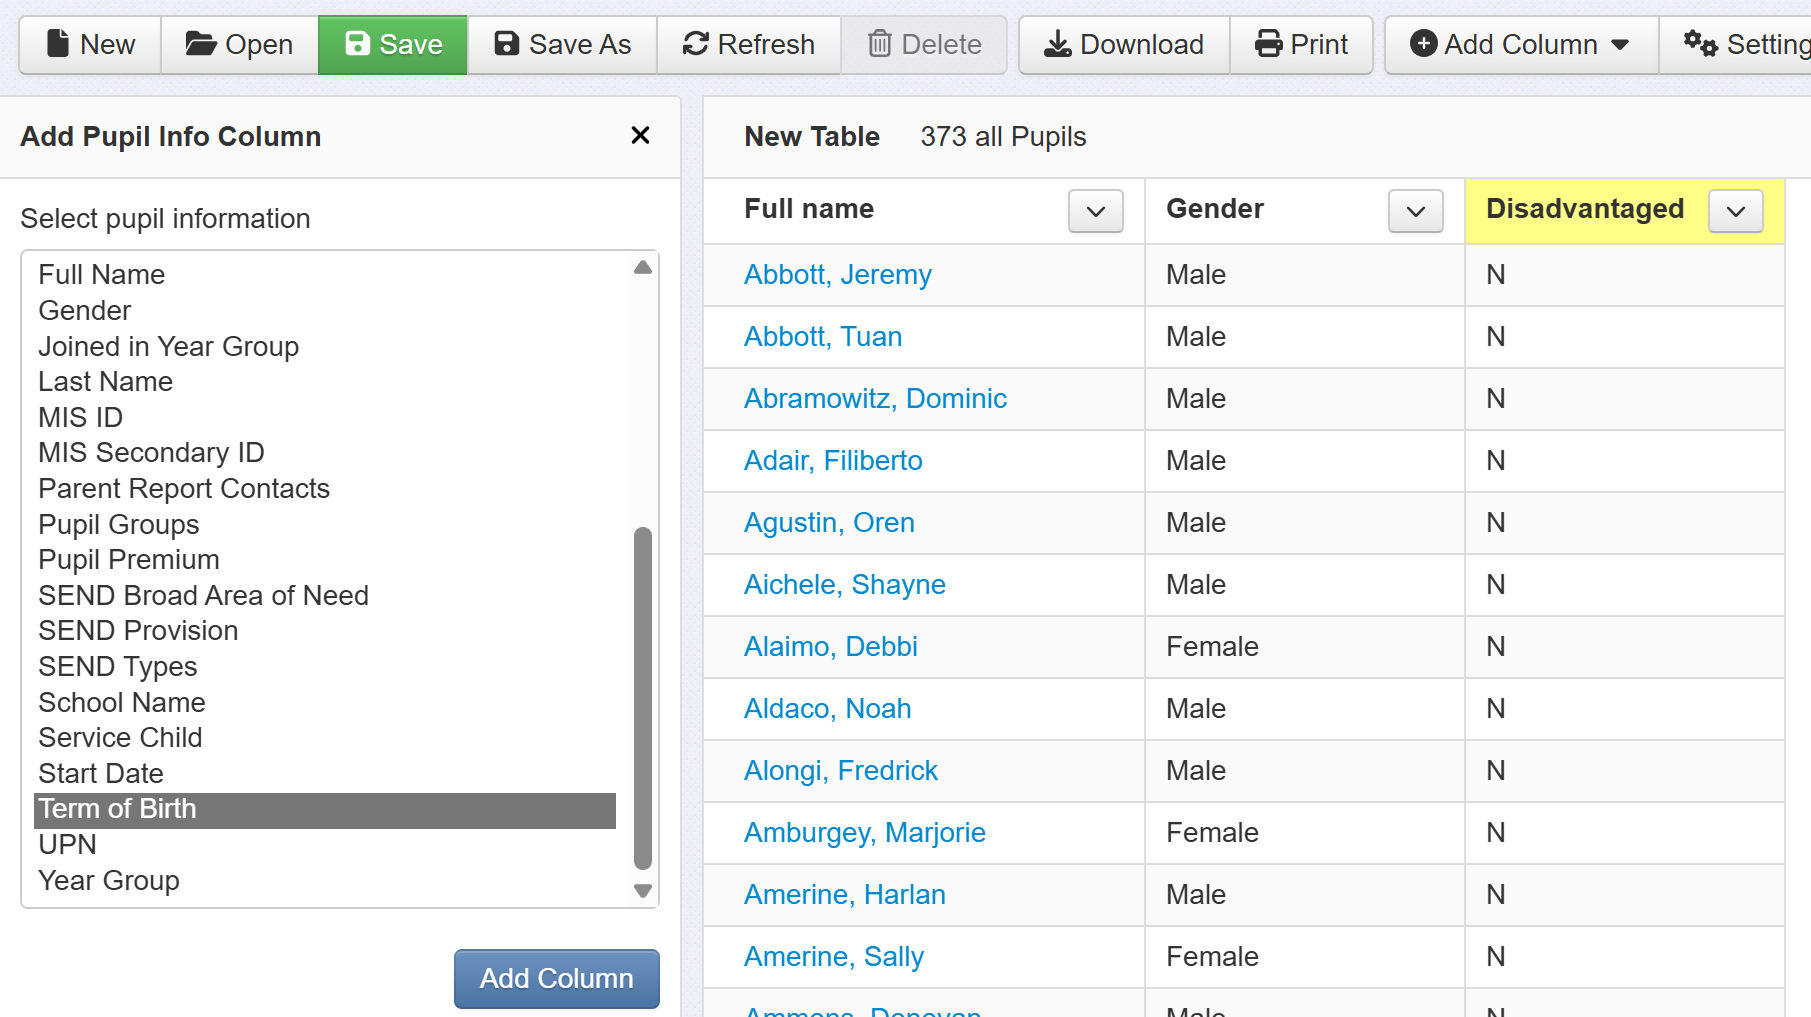
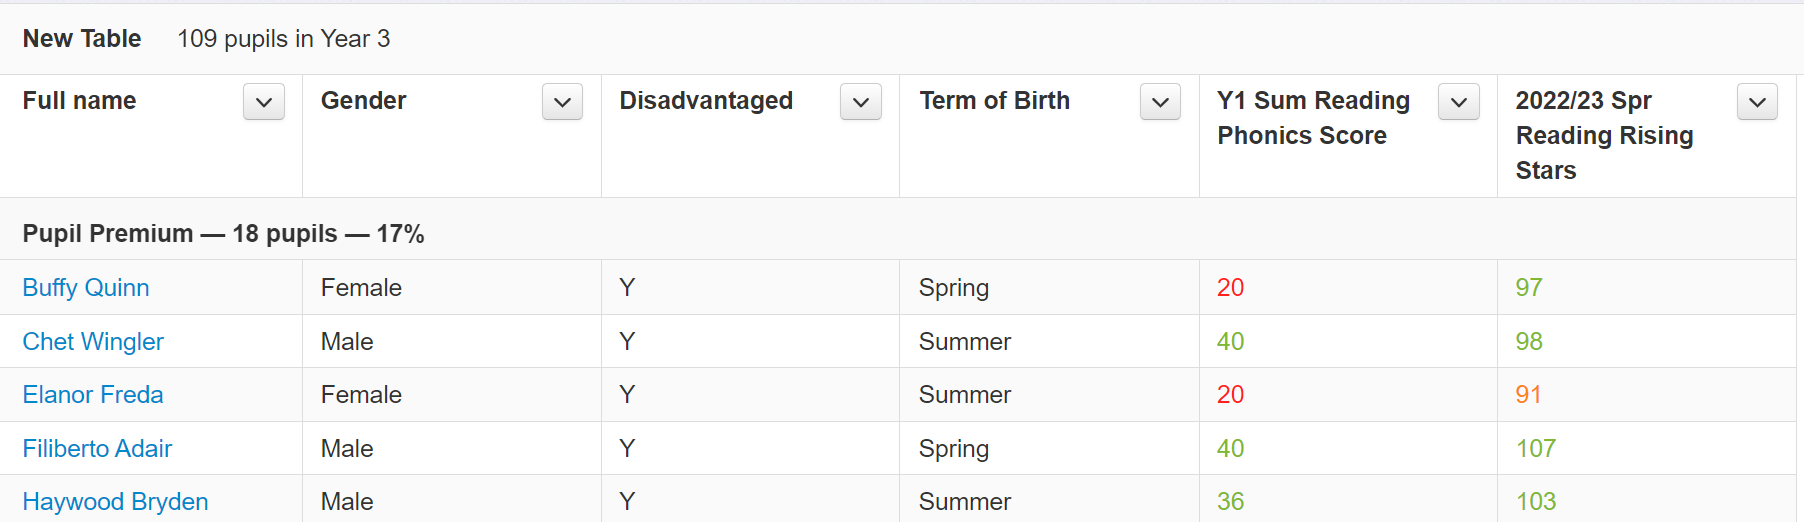
Select an aspect from the list and click the new Add Column button. Then click Add Another Column and repeat. In the following example, columns showing Gender and Disadvantage have been inserted into the table, and Term of Birth is about to be added.
Adding Assessment Columns
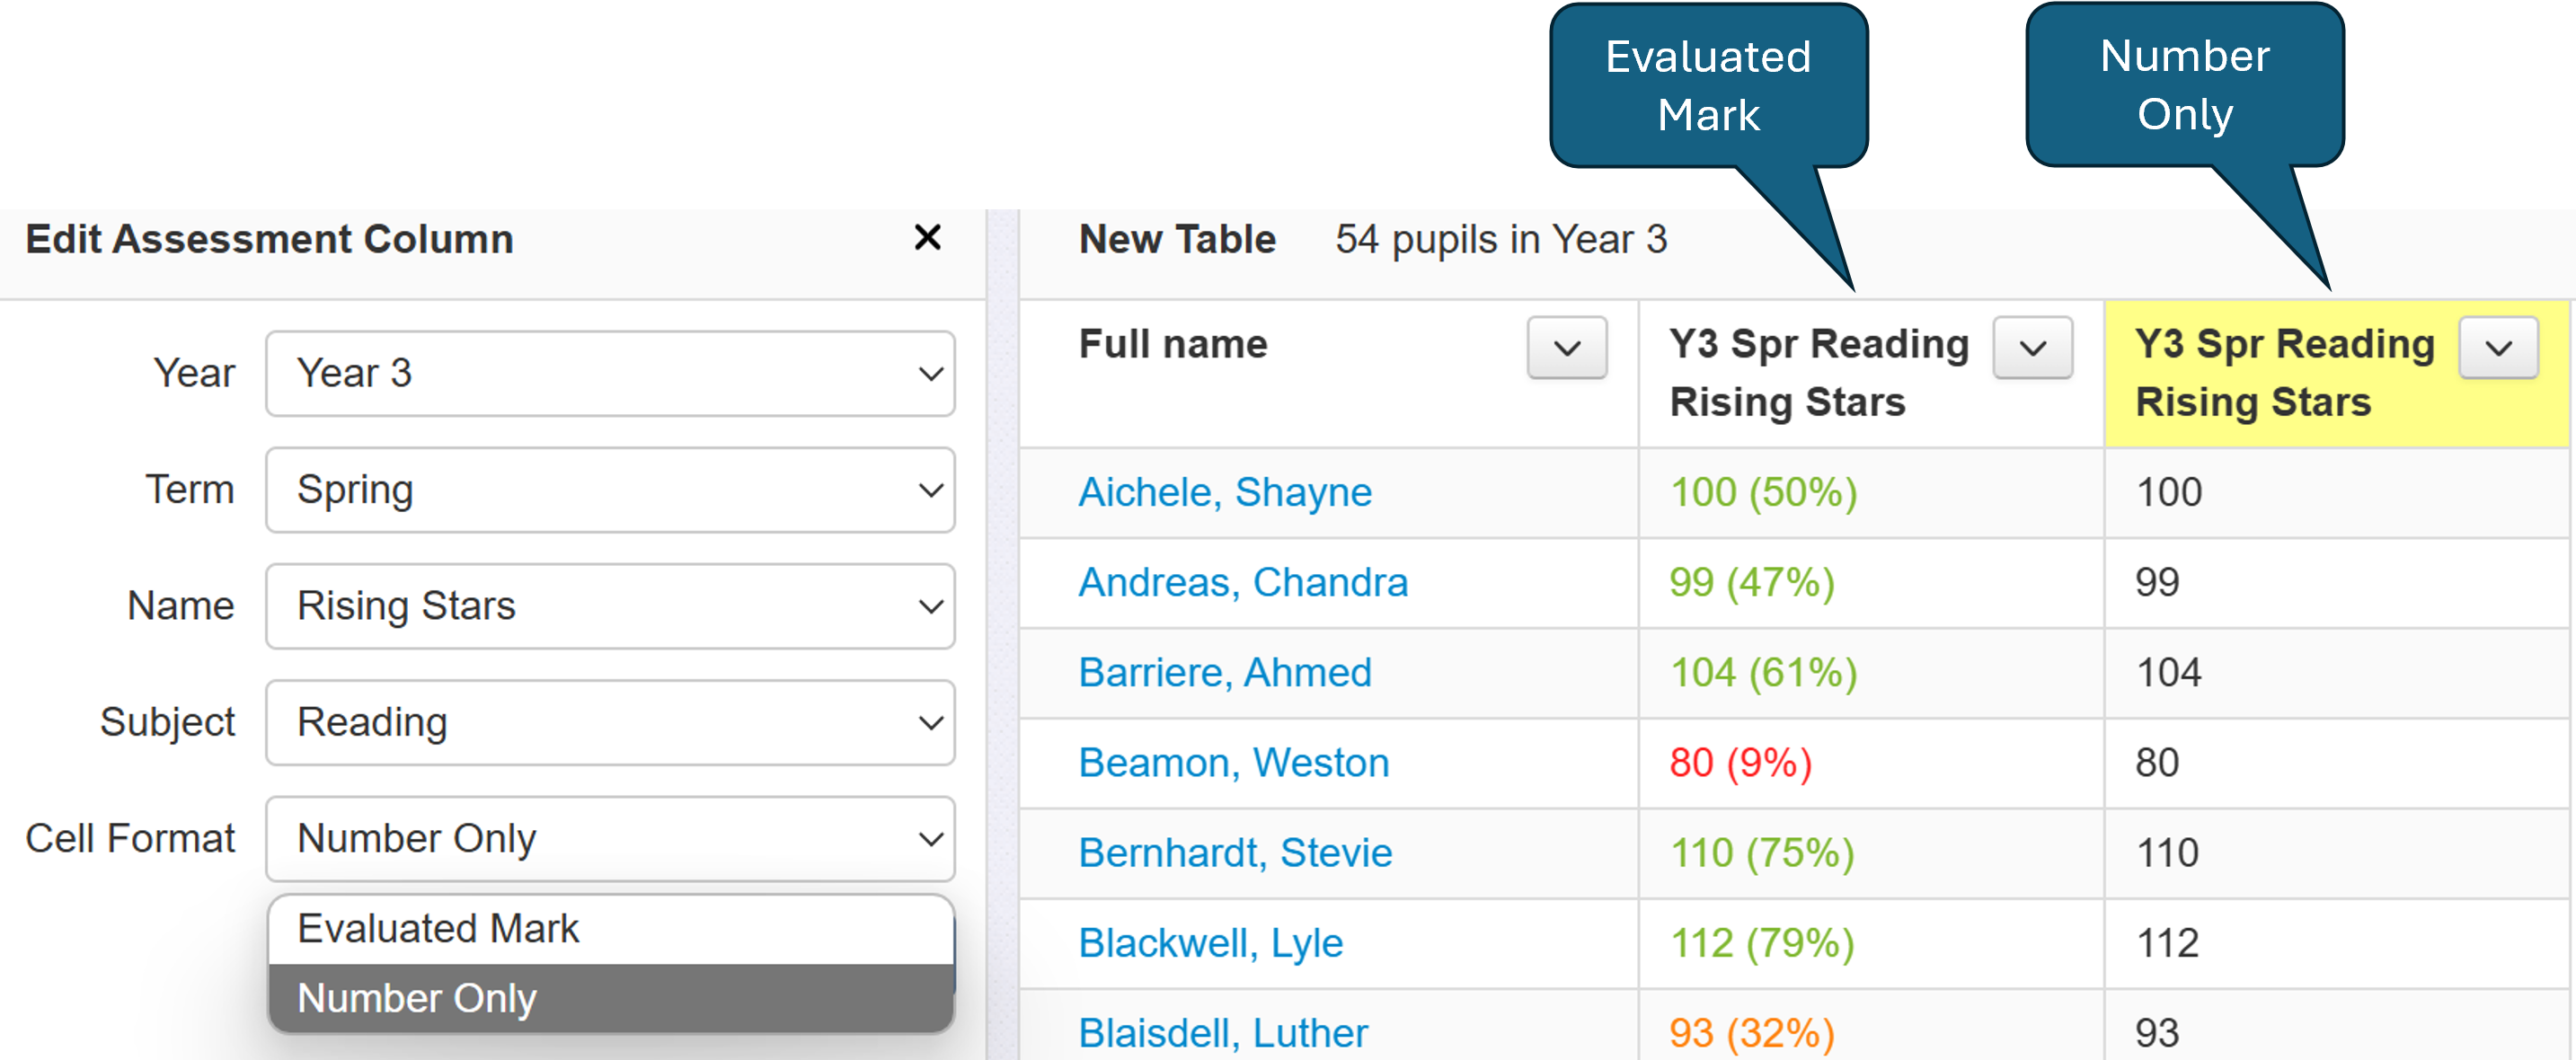
Now let's add some assessment data. Click on the Add Column button again and, this time, select Assessment Column. First, let's add pupils' phonics scores by selecting Year 1, Summer term, Phonics score, Reading, Evaluated Mark.
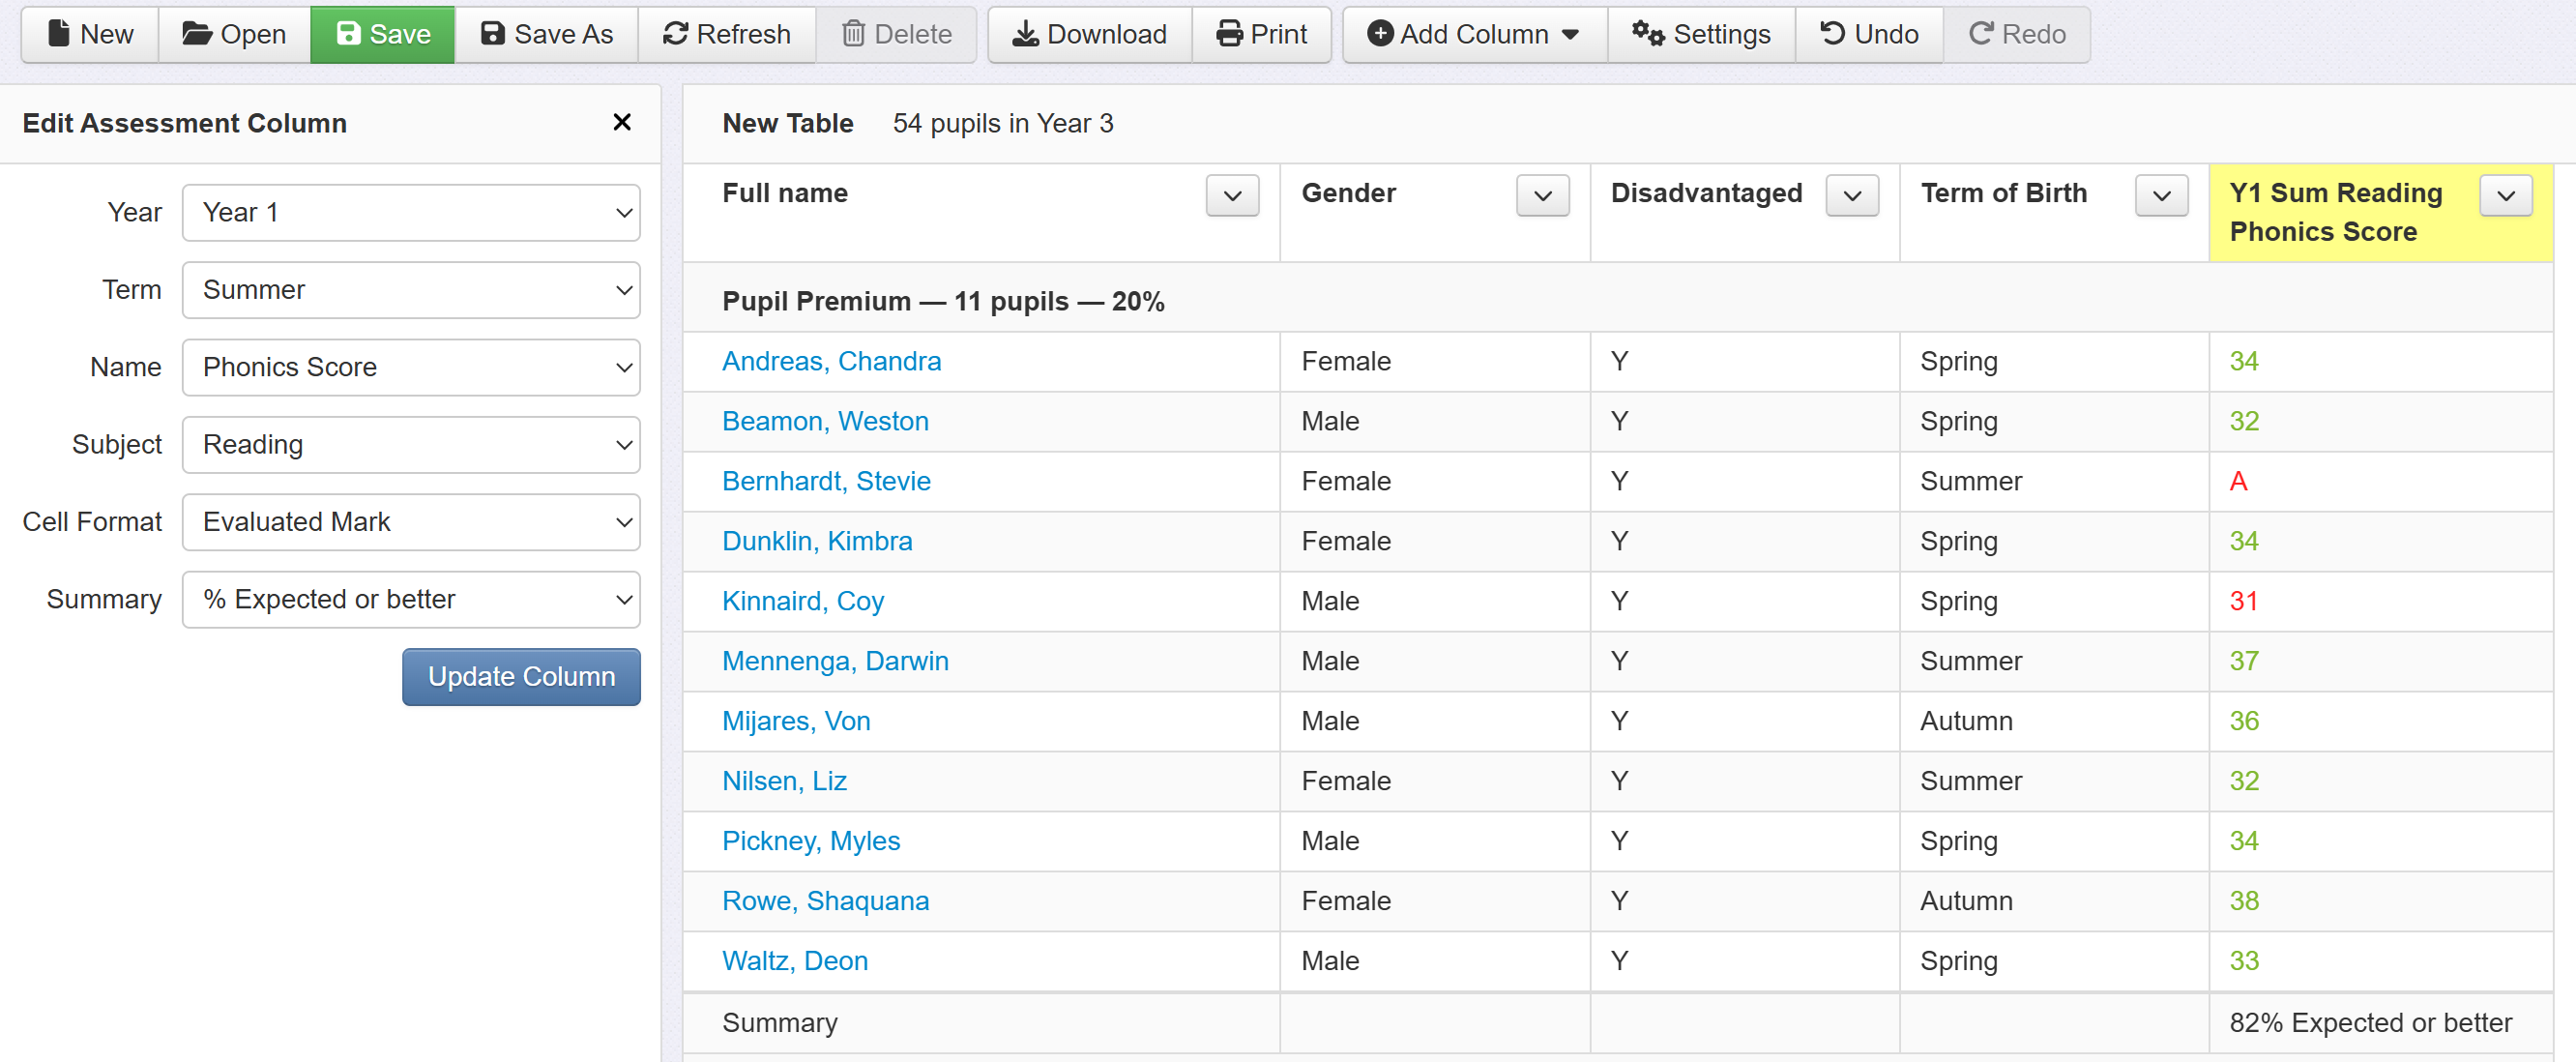
When adding Assessment columns, you are required to choose a Cell Format. As some assessments will have just a mark, such as a PITA band assessment, and others will have both a mark and a numeric value, such as an evaluated standardised score. The choices are as follows:
- Evaluated Mark - If the assessment has both a mark and an associated evaluation, both will be included.
- Number Only - Only the numeric value will be included.
Assessment columns also allow you to choose a summary option to display in the cell at the bottom. You can choose between Average or Expected or better.
- Average - Shows the average value over all those displayed
- Expected or better - This will use the defined evaluation description wording for 'expected' and display the percentage at that assessment or higher
Then we can add a recent standardised test score in reading. Choose Add Another Column (or just use the main Add Column > Assessment button again).
In this example, a column of Rising Stars test scores have been added, but you can add whatever data you like.
Objectives % Secure may also be added, via the Name menu, if required.
Adding Assessment Comparison Columns
An Assessment Comparison Column will show whether a pupil is, for example, working at or above expectations in one or more subjects based on specified assessment data. See our detailed guide on working with these columns.
Adding Progress Columns
Progress columns show the difference between two sets of data and are, therefore, very useful for monitoring the change in assessment over time. See our detailed guide on working with these columns.
Adding Target Met Columns
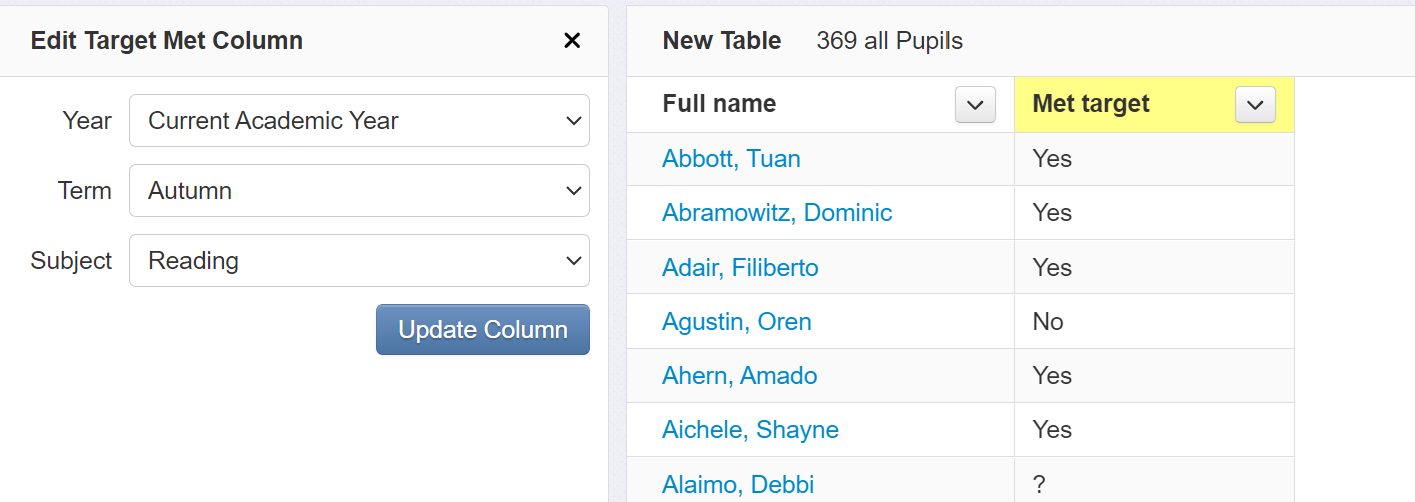
Target Met columns enable you to easily identify whether a pupil has met the recorded target or not, compared to just adding a column showing all the specific target values.
Choose the appropriate Year, Term and Subject to add the column. Yes, No or ? (if there is no recorded target or associated assessment) will be shown for each pupil.
Adding Attendance Columns
Attendance columns include a range of options.
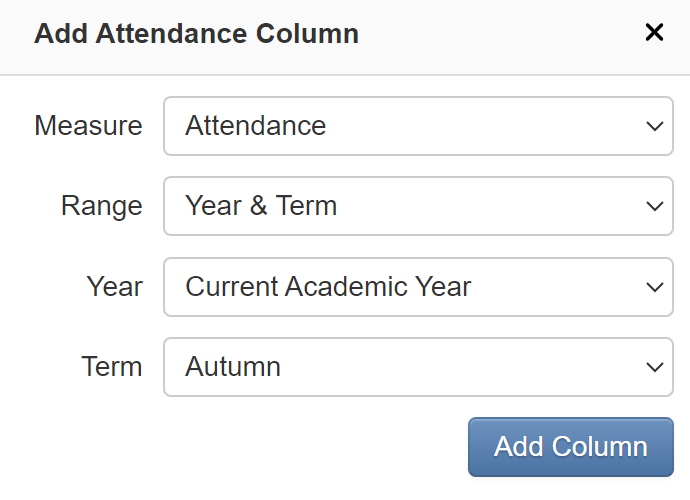
- Measure - What type of attendance data do you want to display? The options include attendance percentages (attended, authorised and unauthorised absence), session counts (including possible and attended sessions), late percentages and counts (including totals and before/after register closed), days missed/attended, broken weeks, selected attendance register codes (choose from all codes and include counts of instances) and the DfE penalty consideration notice threshold (currently meets or previously met).
- If you choose Attendance, the values in the cells will be coloured according to the Attendance Thresholds set via Admin > Attendance Thresholds
- Range - What time frame are you interested in? Choose from Year & Term or a specific Date Range.
- Year and Term then requires a year to be selected followed by a specific term or all terms in that year combined.
- Date Range then requires a start date and an end date to be defined.
Adding Learning Barrier columns
See the learning barrier help guide for how to customise your learning barriers.
Adding learning barriers to a Table report allows you to see which of your learning barrier items each pupil matches, as well as their individual learning barrier score.
In a Table report, click the Add Column button and choose Learning Barriers Column from the menu.
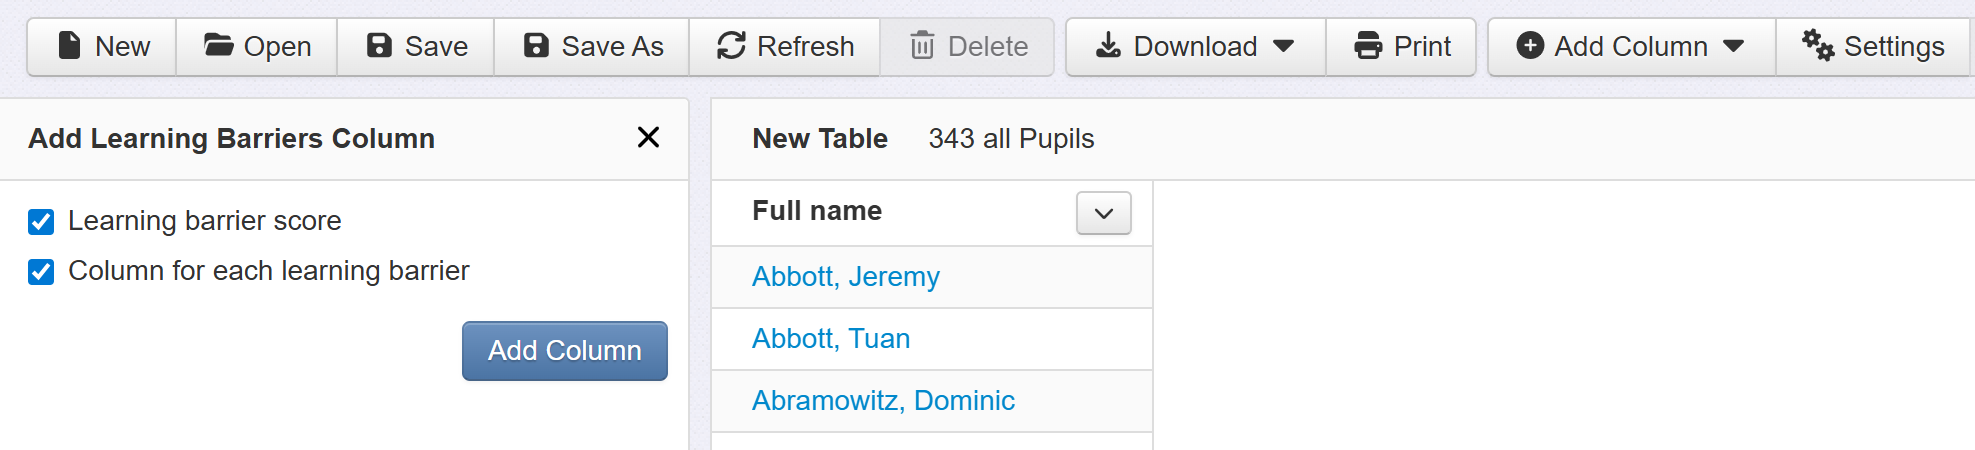
You can then choose to include a single column showing the individual, per pupil, score. The score will be coloured according to your learning barrier evaluation ranges.
You can also include a column for each learning barrier item in your list. A tick will appear for any pupil who matches on that item.
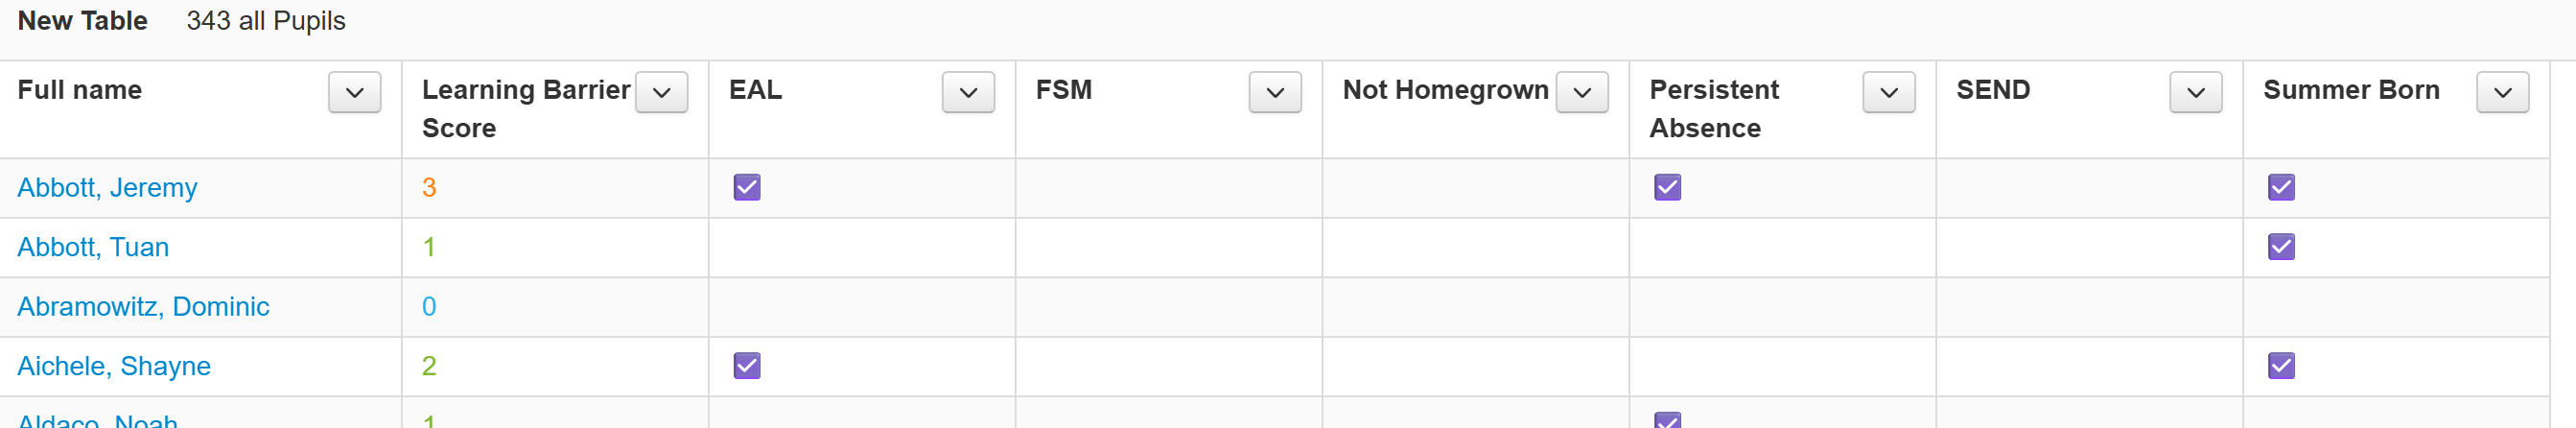
The learning barrier columns will be ordered according to the order you have set via Admin.
Adding Learning Plan Columns
If you're making use of Learning Plans in Insight, these columns enable you to include useful references to them in your Tables reports.
Learning Plan Template allows you to display the most recent Learning Plans or to choose a specific Learning Plan template type.
There are then three different columns to choose from.
Link to learning plan adds hyperlinks to make it easy to quickly view a pupil's learning plan.
Creation date and Review date enable you to see how long a plan has been running and when it is due for review.
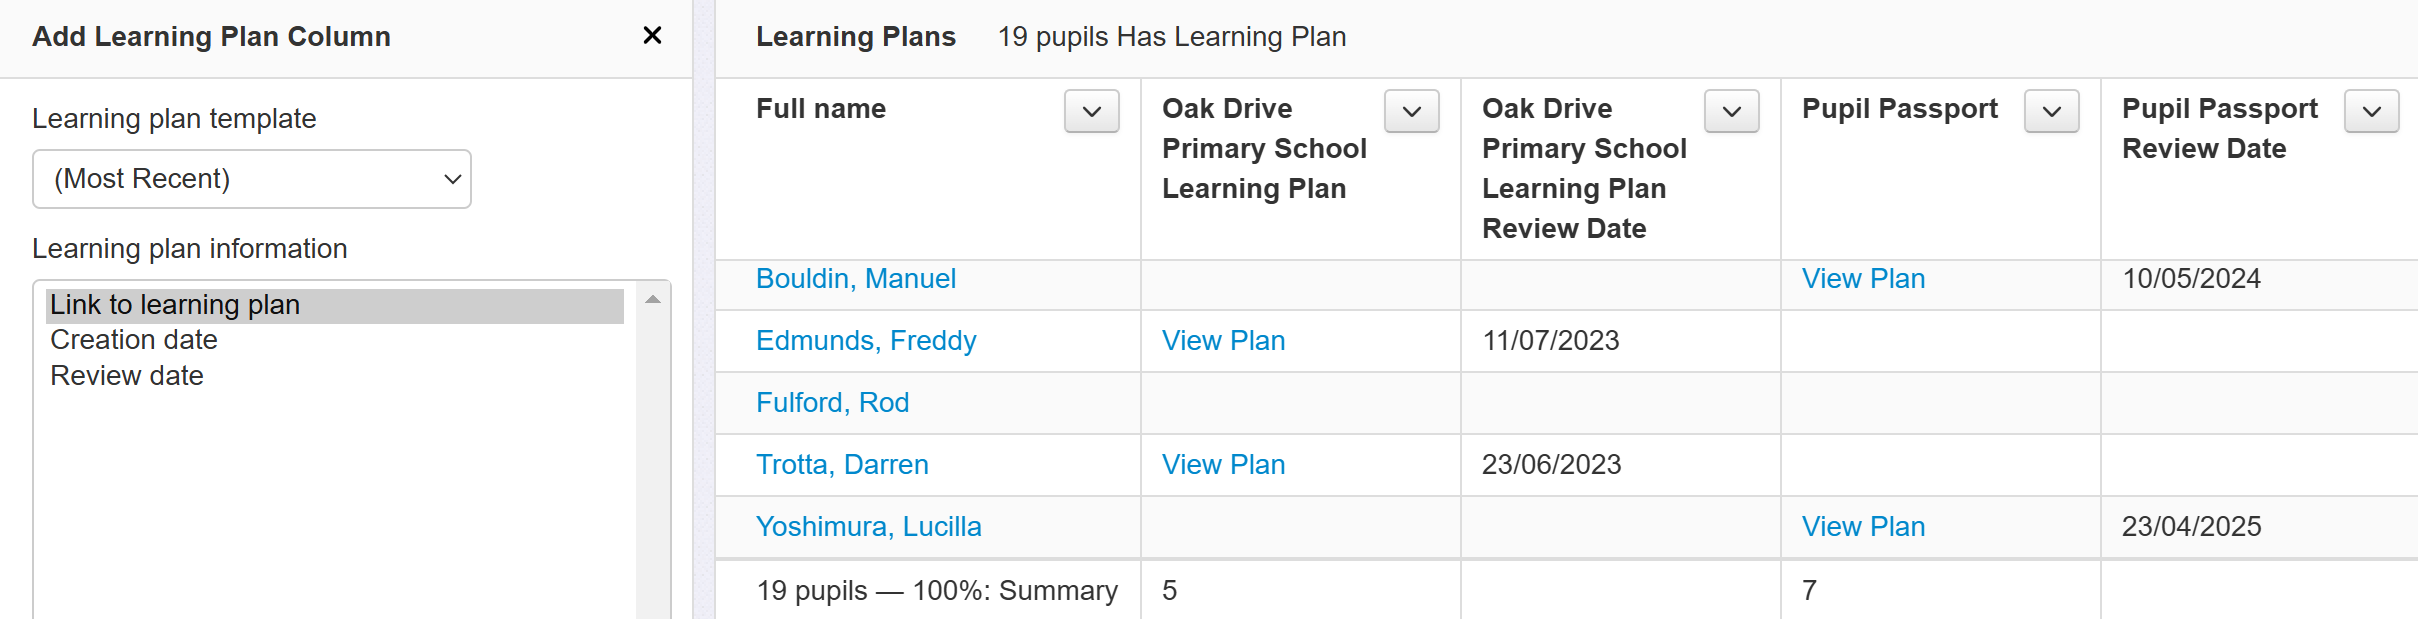
The Link to Learning Plan columns will include a total number in the summary row.
Adding Provisions Columns
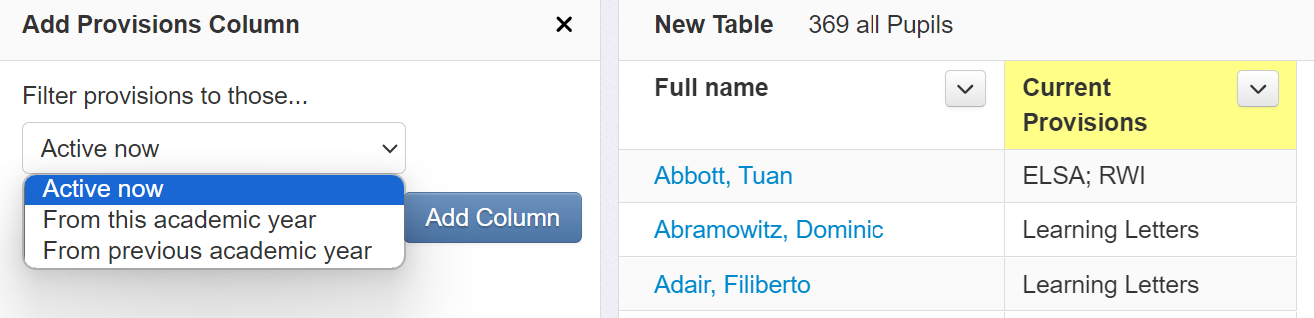
If you're making use of the Provision Mapping feature in Insight, this column enables you to see the names of any Provision Types a pupil is currently engaged in as part of a Provision Group.
To ensure you see the appropriate types listed, you can choose to just list the currently active ones, those that have been active during the current academic year or those that were active during the previous academic year. Multiple Provisions columns are also possible if required.
Removing pupil names
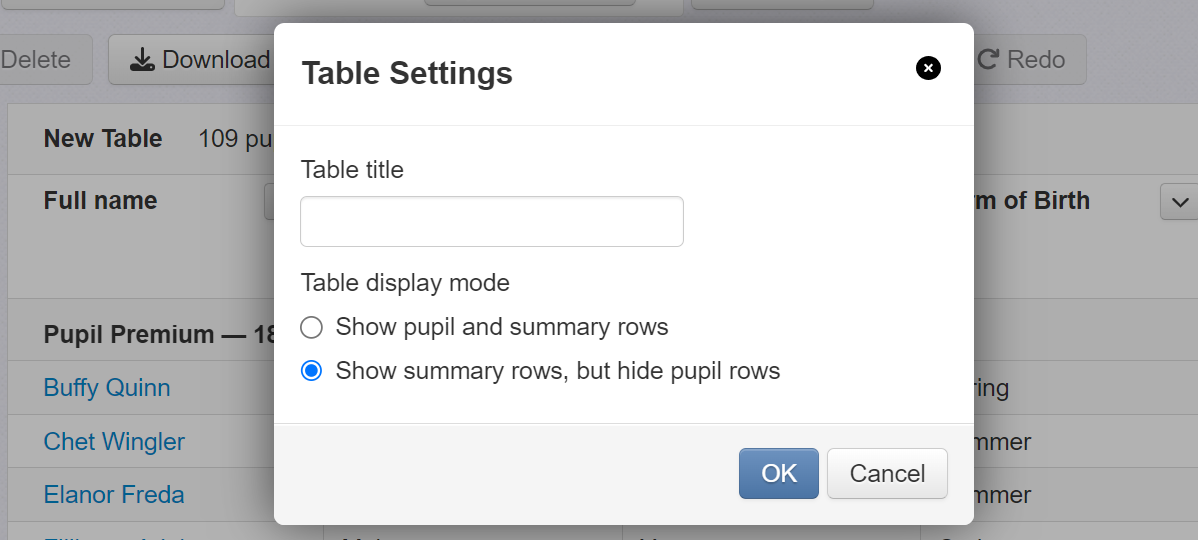
If you want to remove the pupil names, to show the table to governors for example, this is easily done by clicking on the Settings button. At this point you'll be prompted to give your table a name.
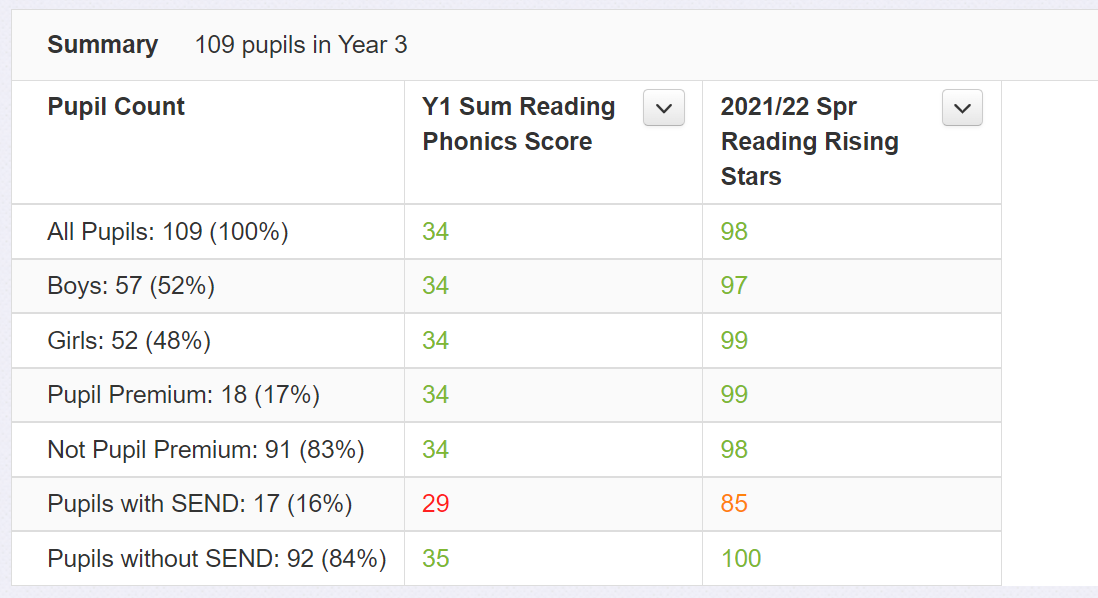
To remove pupil names, click the 'Show summary rows, but hide pupil rows'.
This will produce a table as follows.
To compare with the key filter groups set for your school, switch the pupil grouping option from Pupil Premium to Key Groups.
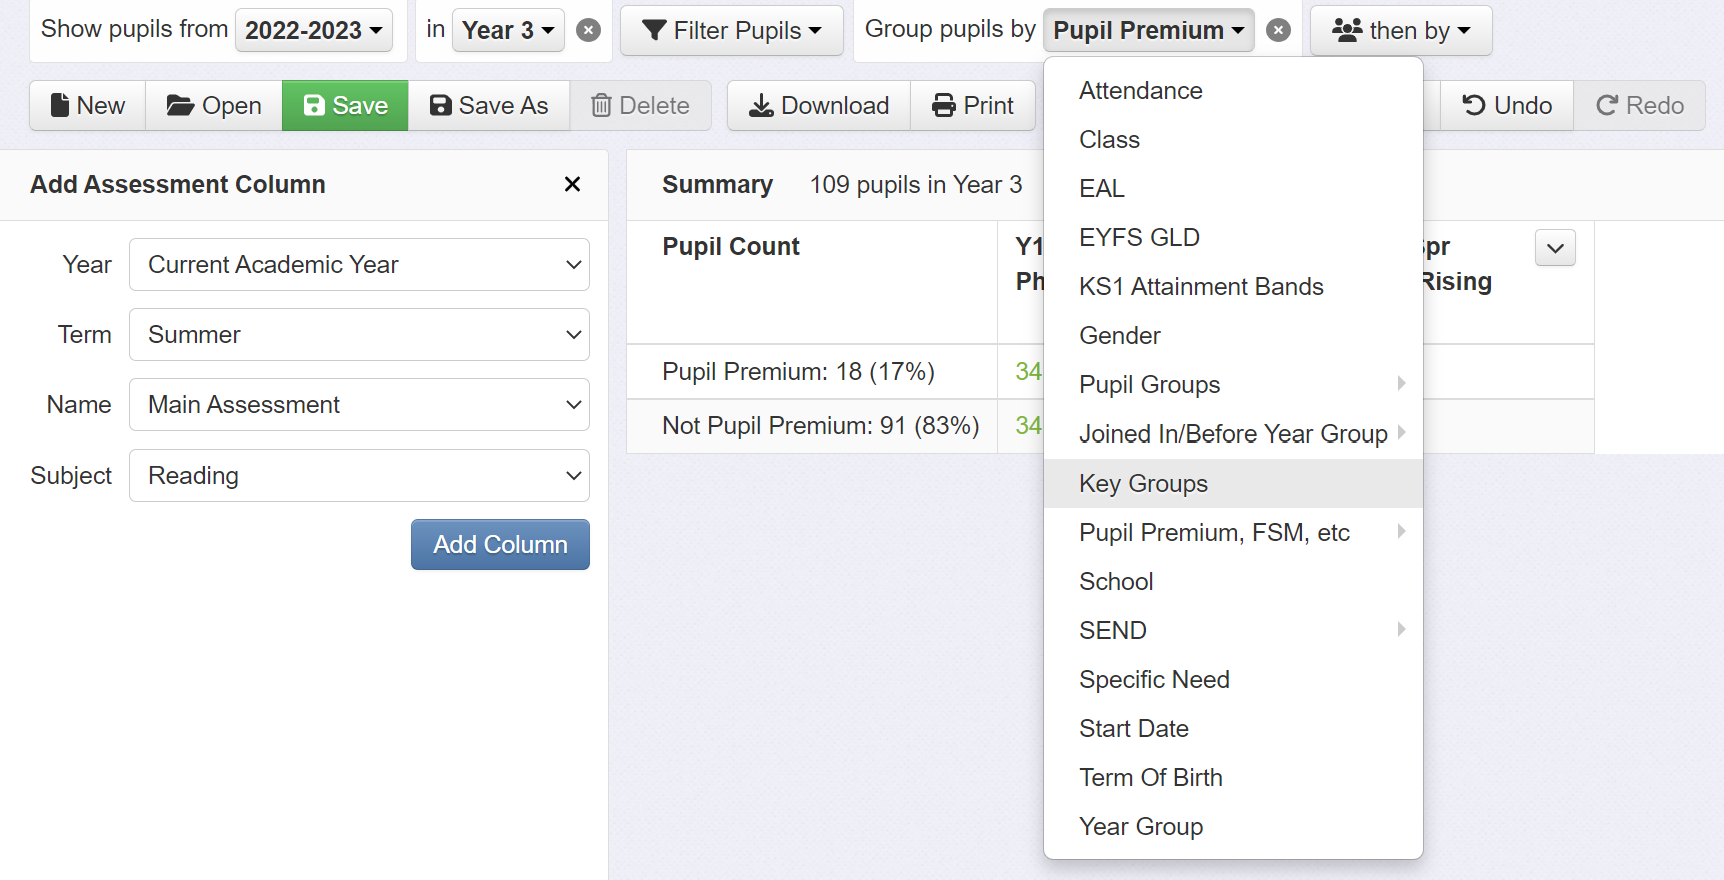
This changes the table grouping from Pupil Premium/Not Pupil Premium, to your list of Key Groups, as follows.
Loading reports
Once you have built and saved your table, you can find it again by clicking the Open button.

Under this menu you'll also find preset table templates provided by Insight, as well as any provided by a Trust you're part of.