Attainment Overview report
 Updated
The attainment overview is an easy to use and visually engaging report that will bring your data to life, making it accessible to a range of key audiences. If you want a quick summary of learning across your school, this is a great place to start.
For Trust users, there is also an Attainment Overview report showing data for all the schools in the Trust.
This guide will walk through some examples to show how to:
- Access and run the Overviews - Attainment report
- Use the report controls to select subjects and different types of assessment data
- Make use of filters and grouping tools to explore the data
- View a Venn diagram showing combined attainment
- Use the 'Advanced Options' to create different views of your data
- Select the whole school and compare year groups
The guide also includes top tips to help simplify the process and get the most from the report.
Creating a report
Click on the Reports menu and select Overviews – Attainment.
This will load the report for the most recent pupil groups you have been viewing for the current term, with Reading, Writing and Maths displayed. Here we're looking at year 5.
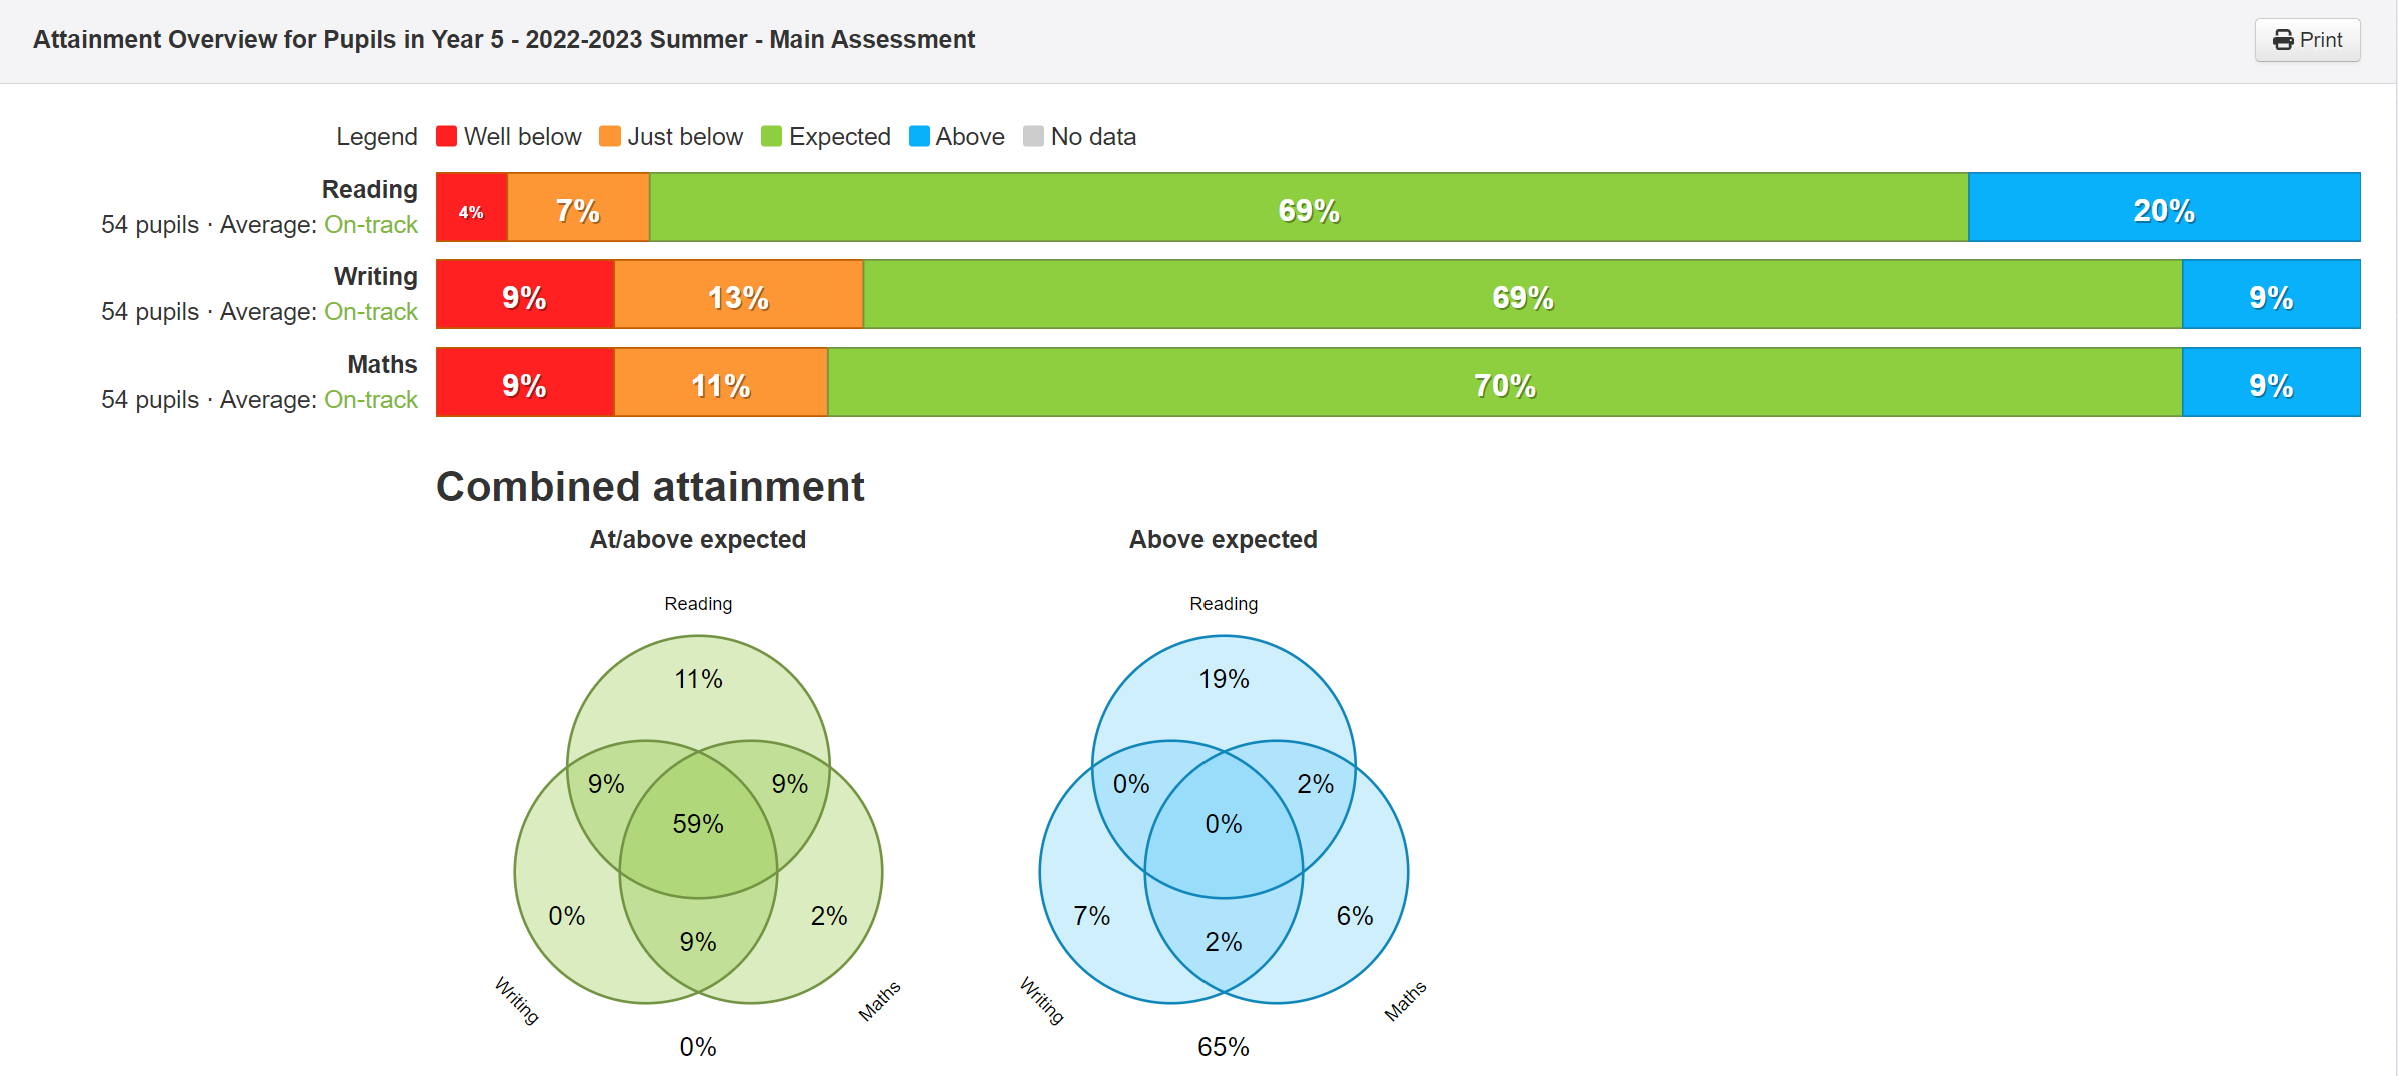
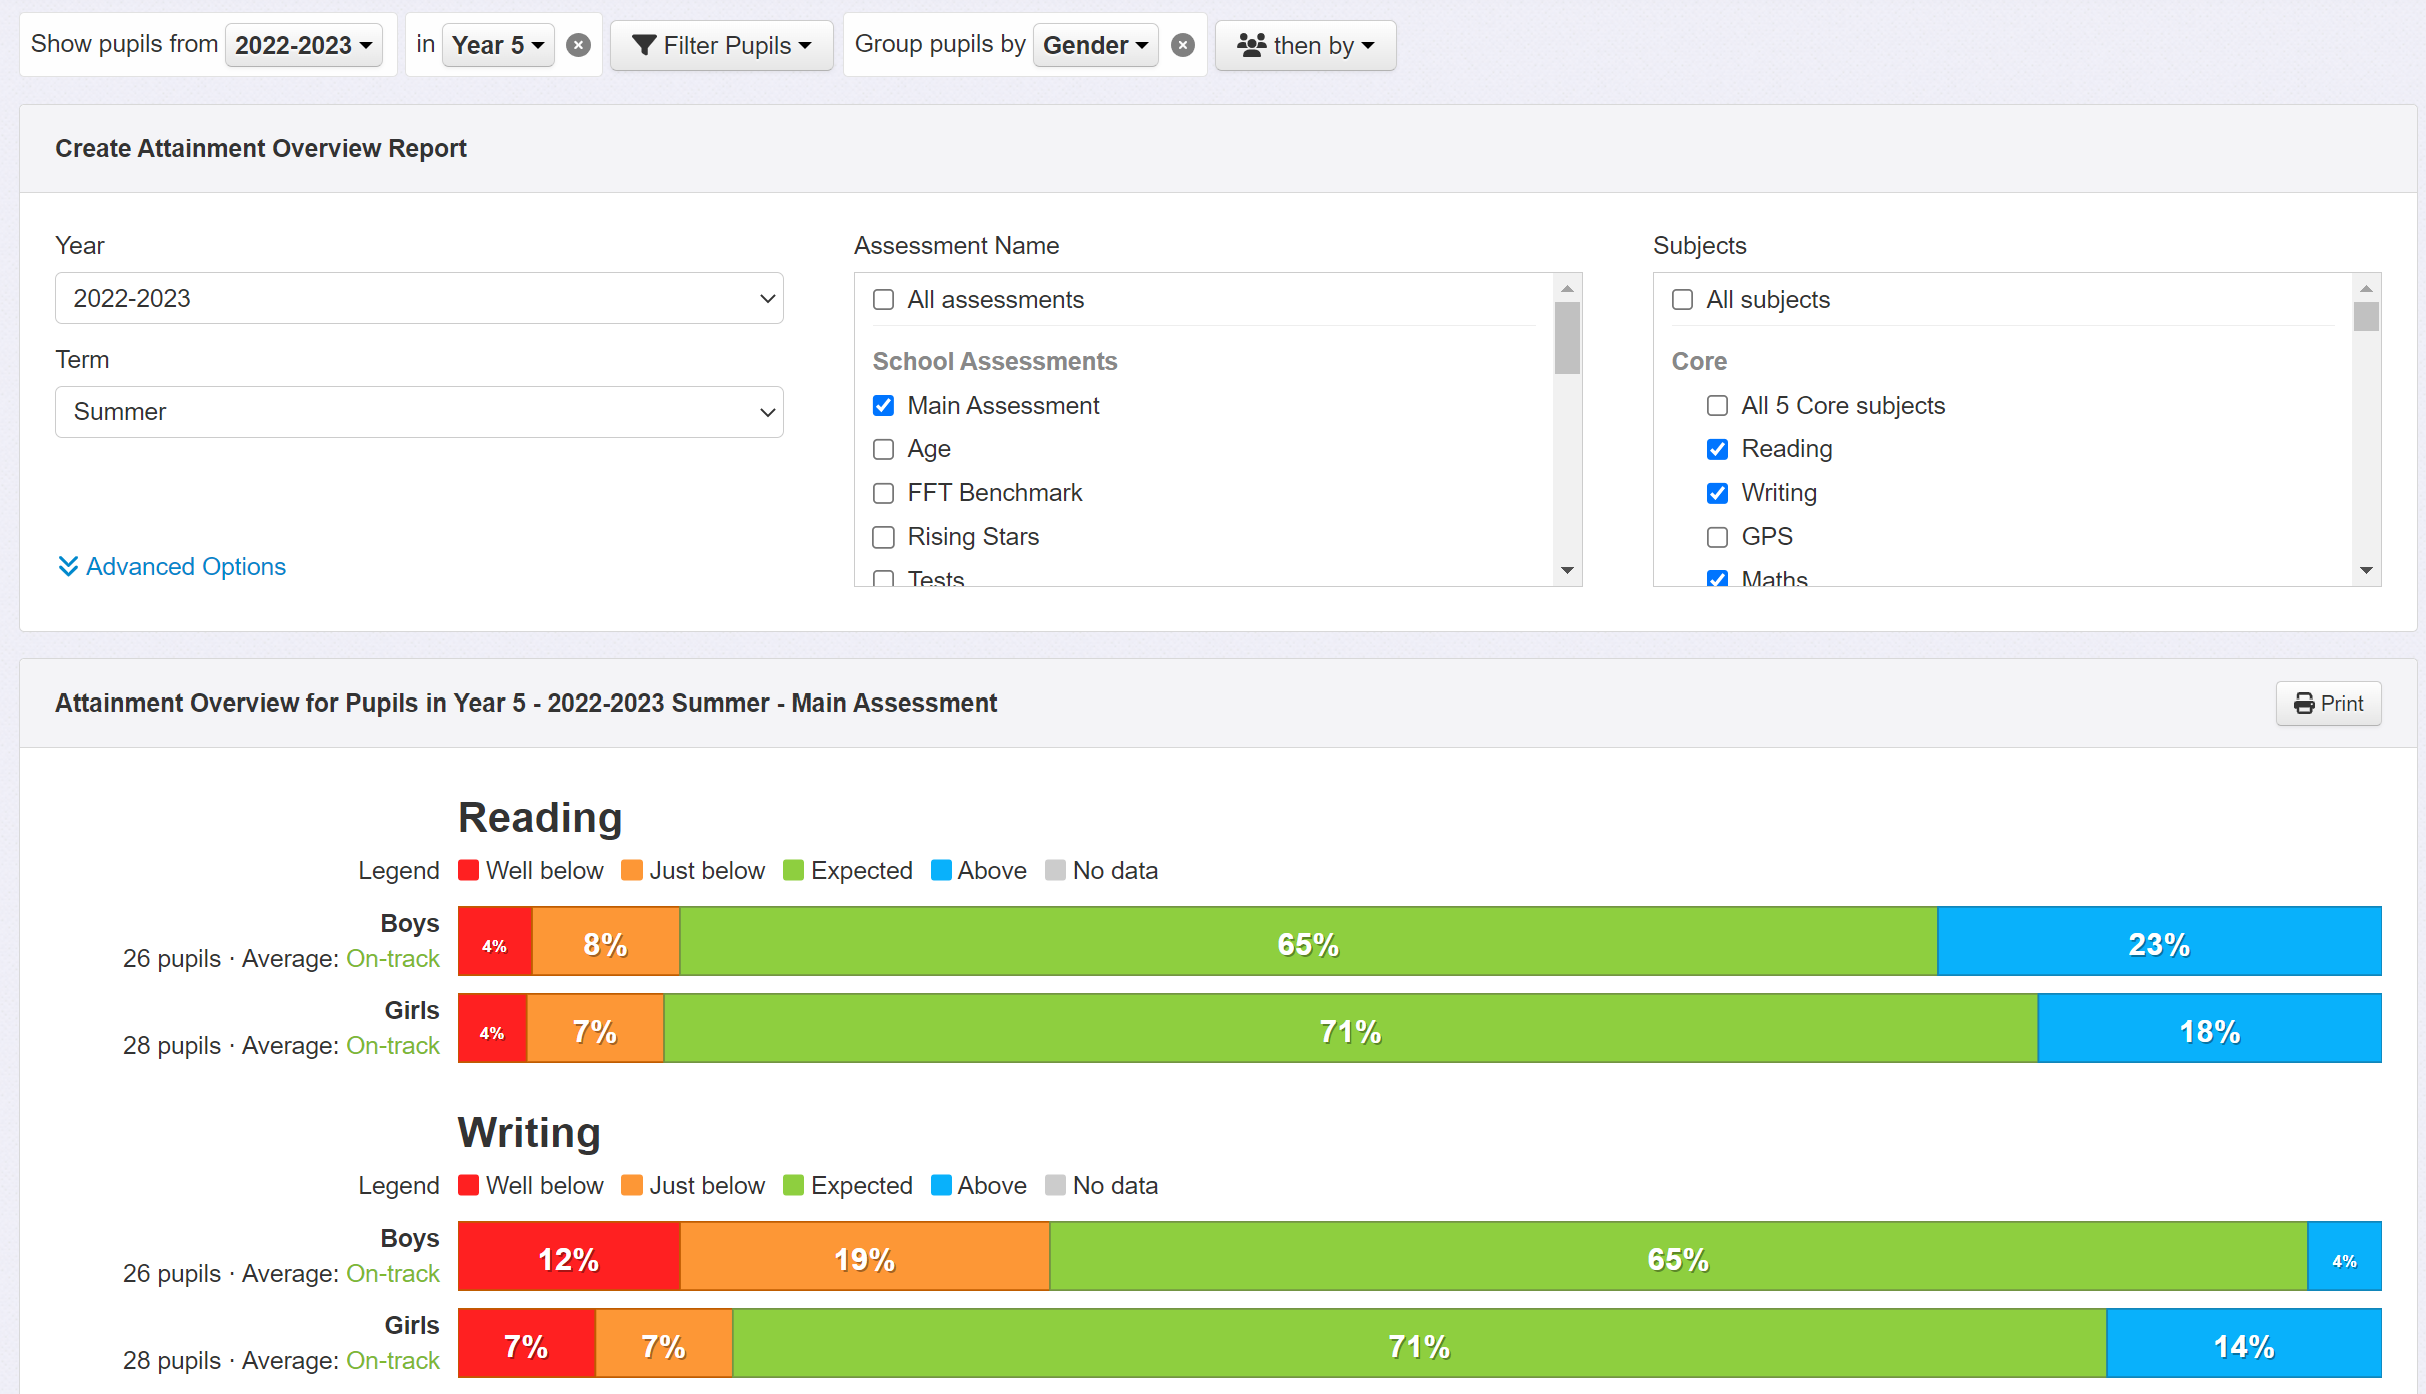
You will notice there are several options: you can select academic year, term, assessment type, and subject.
To show KS2 RWM Combined, as a single subject, you'll need to choose the subject called (calculated) at the bottom of the subject list.
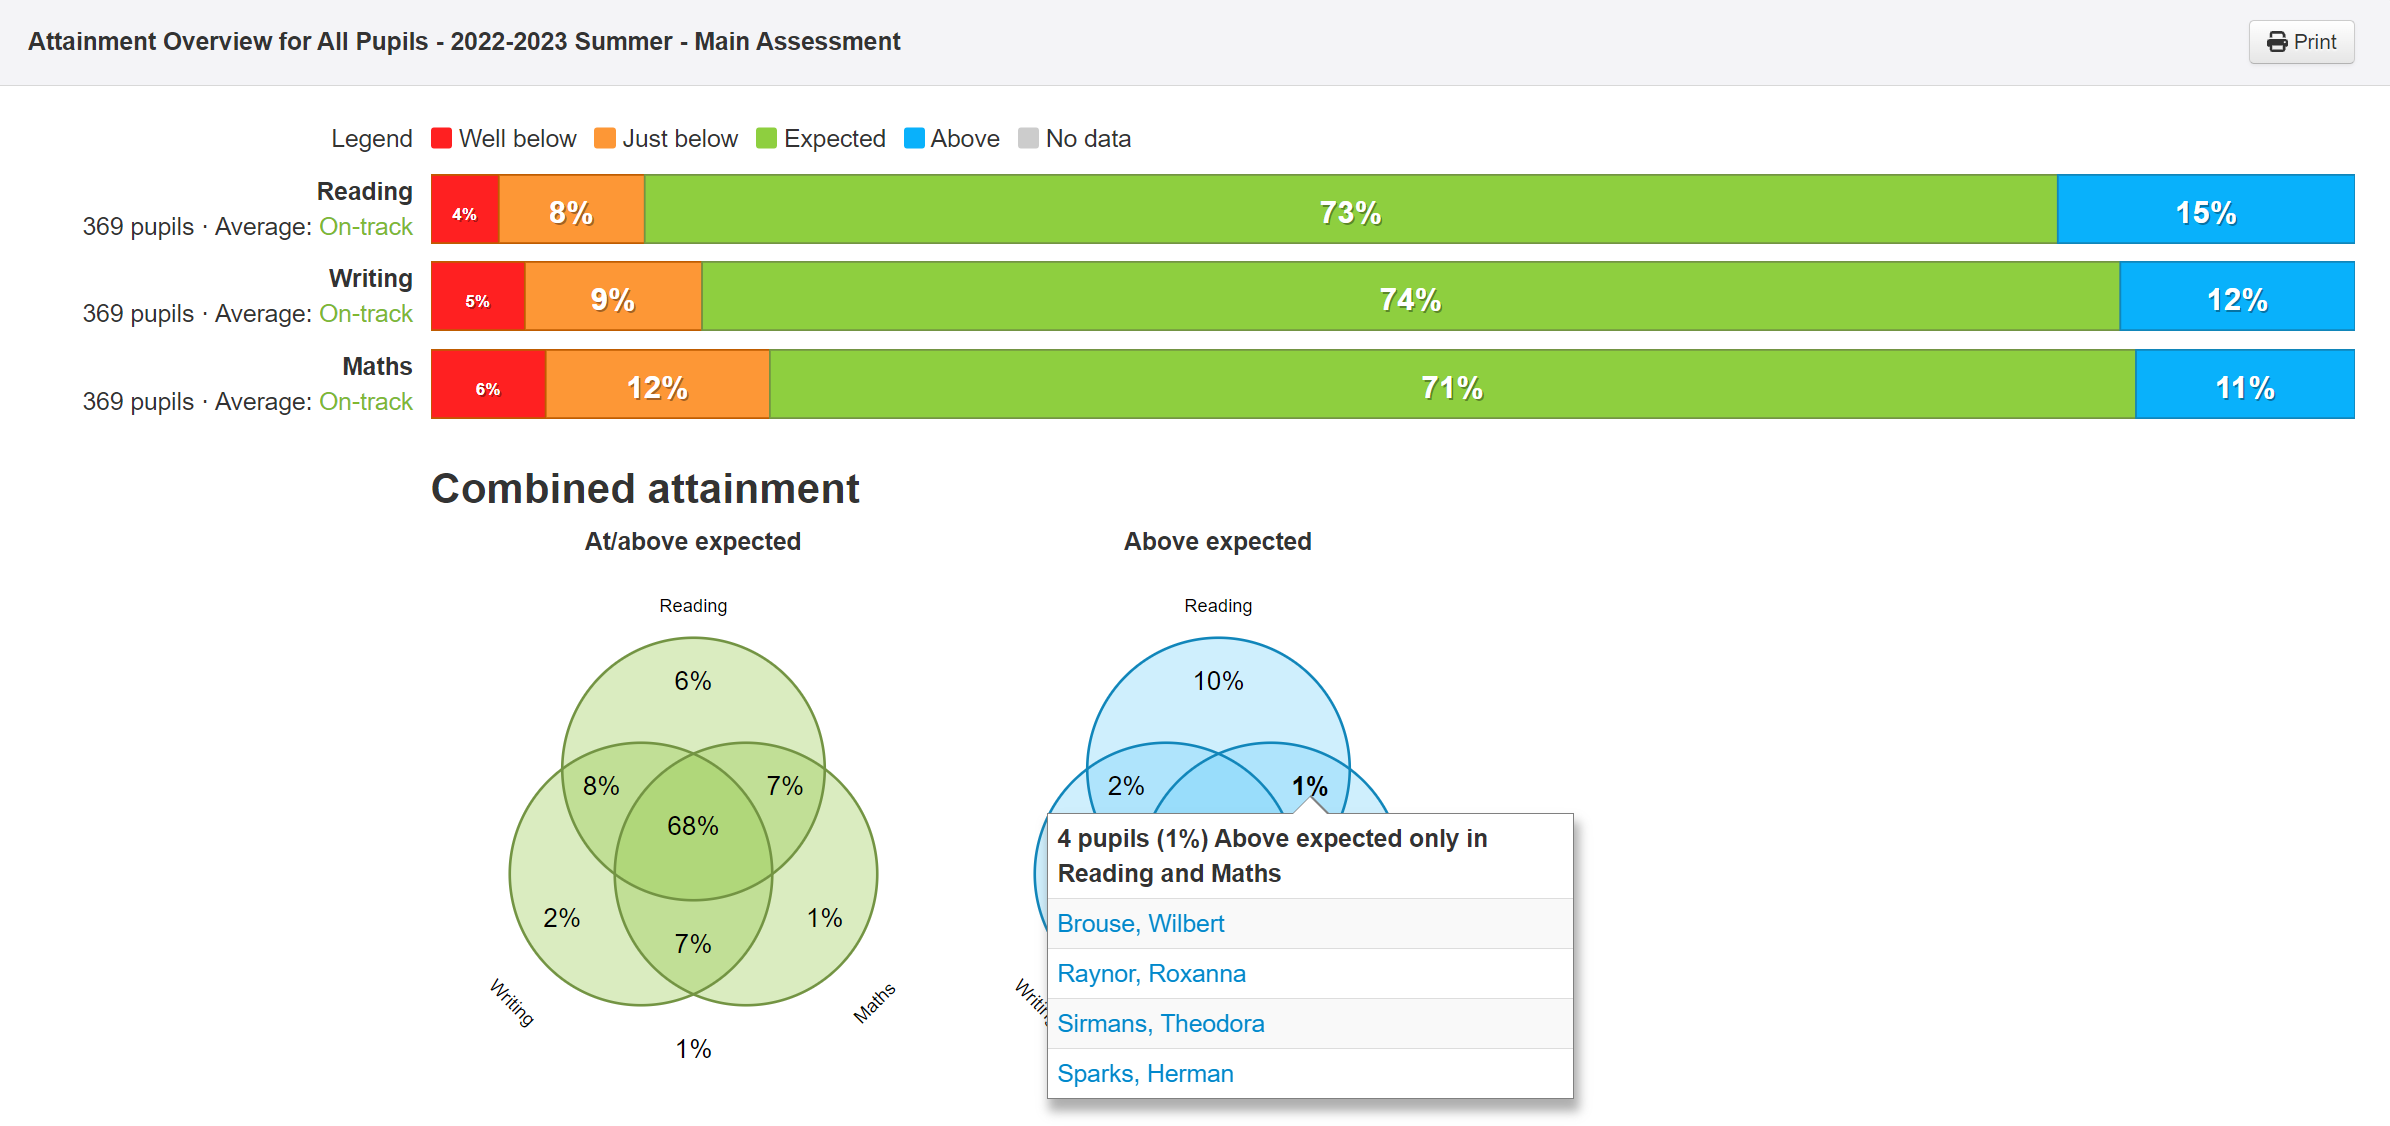
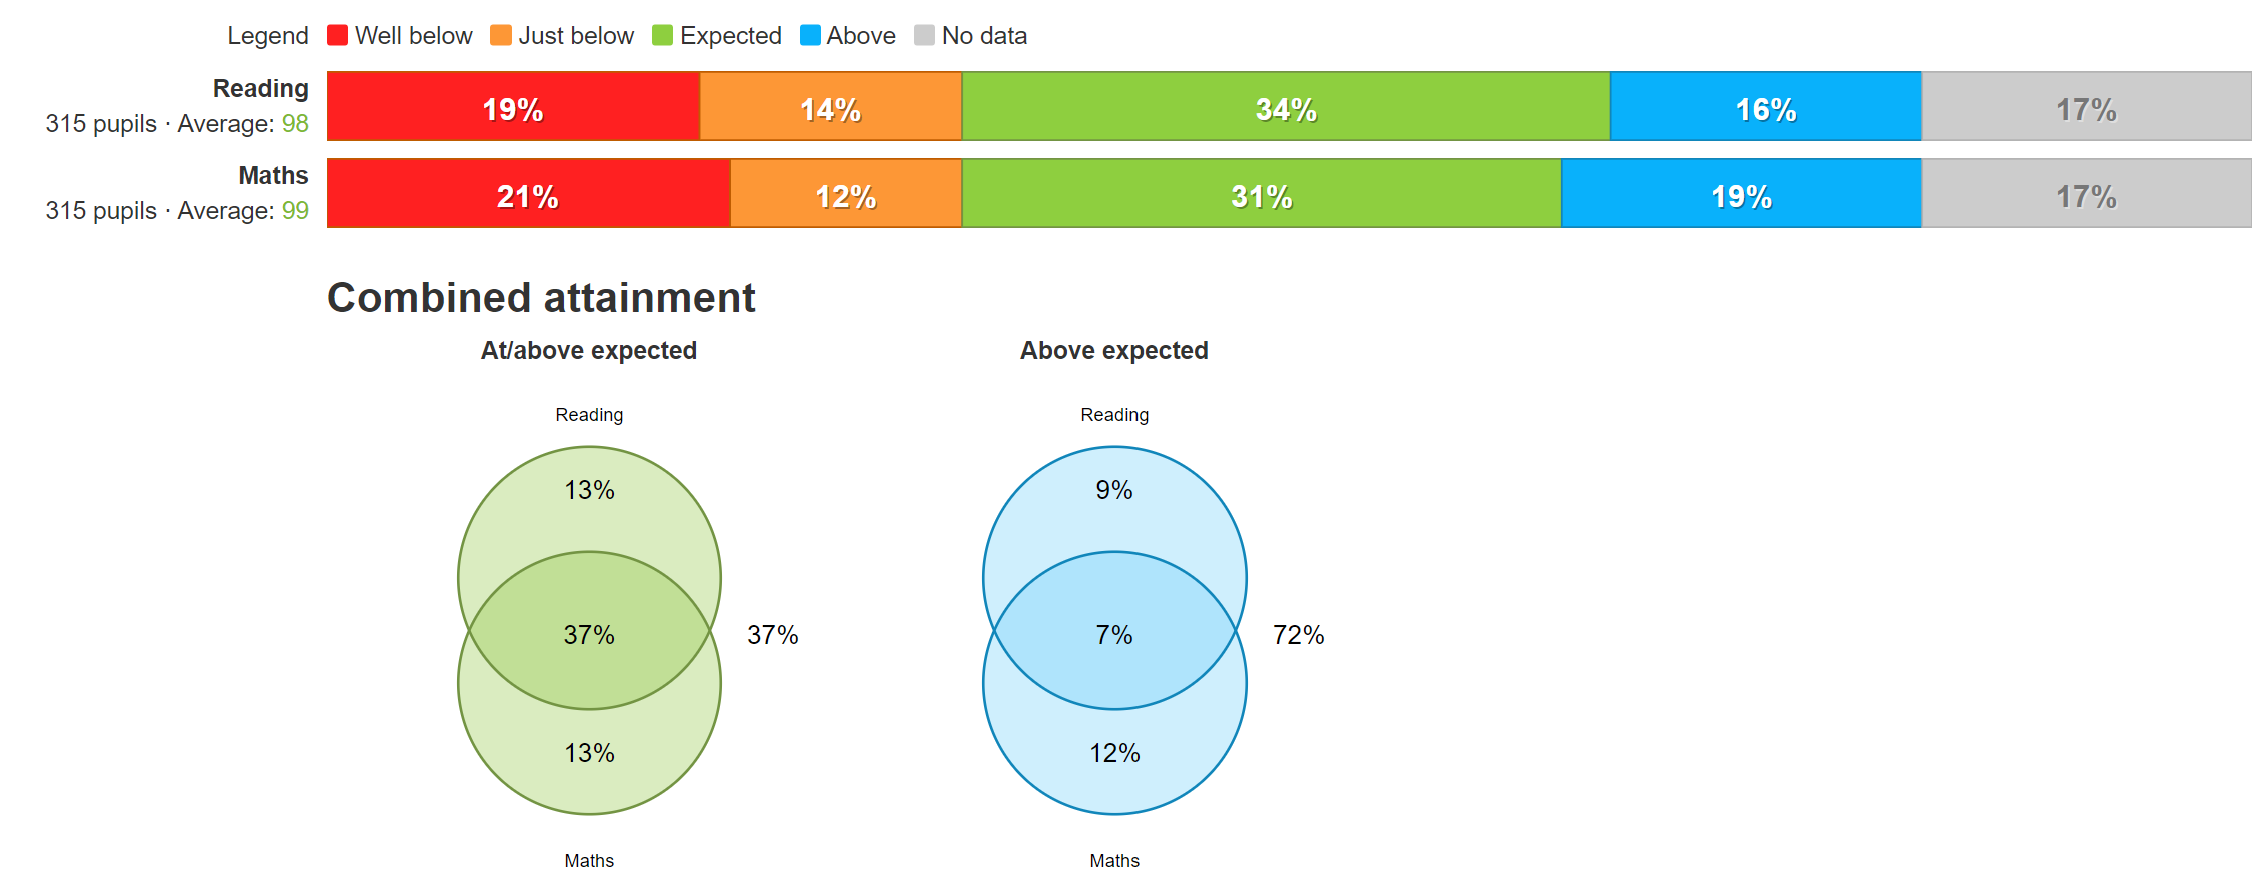
You can hide the combined attainment table/venn by clicking Advanced Options and de-selecting 'Show stats for combined attainment'
The Venn diagrams compare selected subjects only (not contextual comparisons). They appear if you have two or three subjects selected, only.
Exploring the data
Insight's filtering and grouping options allow you to define which pupils you want to include and how you want to compare them. These are accessed via the Filter Pupils and Group Pupils buttons at the top of the screen. Here’s a simple example, the Gender option has been applied from the Group Pupils menu. We can now compare the attainment of boys to that of girls, with a bar and set of Venn diagrams produced for each group and subject.
If you're using the Trust version of the report, you will have the option to group by School.
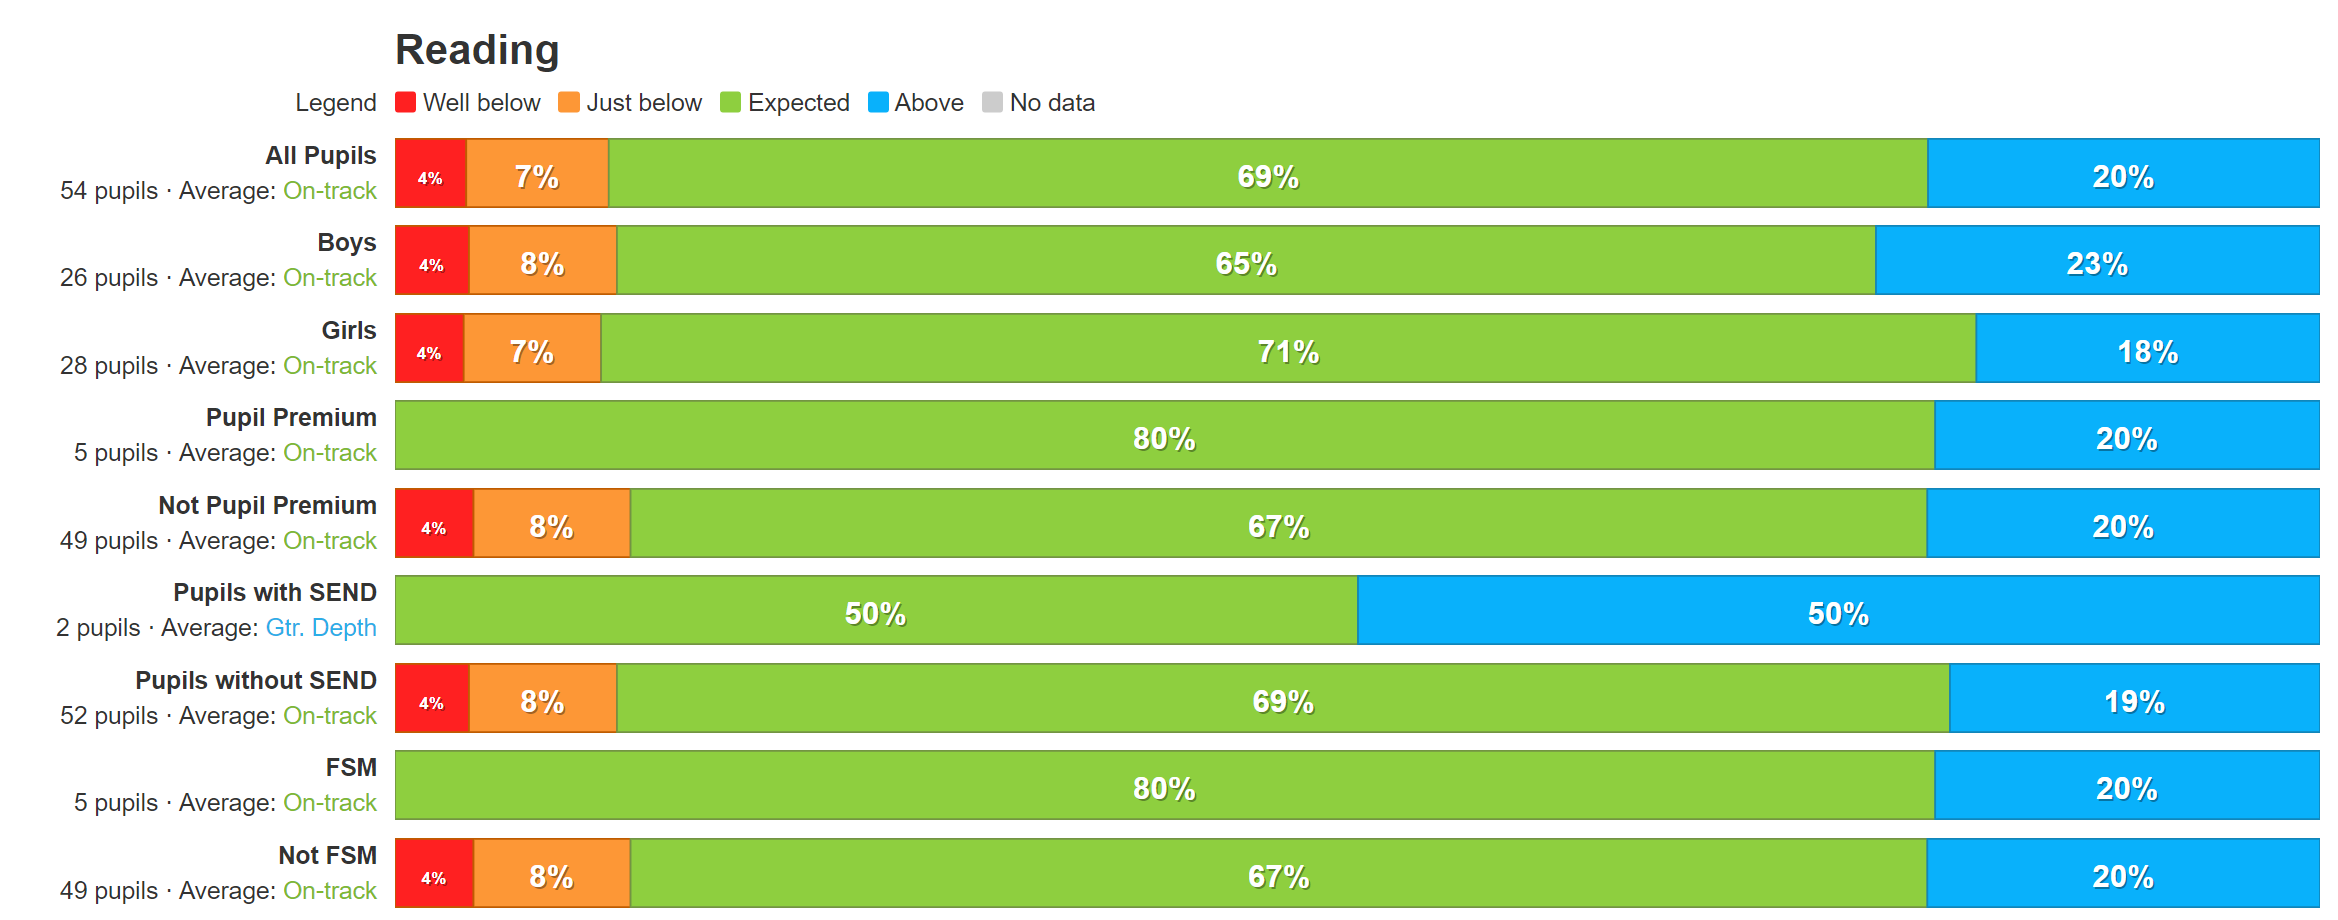
Another useful option is to group by Key Groups. This will break our data down by all main groups of pupils in one go. Again, click the ‘Group Pupils’ button and select ‘Key Groups’ from the dropdown menu. Now we can compare the attainment of all the main key groups in one report.
Broaden the scope: multiple year groups
So far we've focused on year 5. You can use Insight's filters to look at a class or other set of pupils instead (such as all children with SEND across the school). Let's look at a useful example of viewing data for several year groups at once.
If you're following along with your own data, start by clearing any active filters and groups by clicking the ‘x’ against any filters and/or groups you can see. Then click Filter Pupils and choose Year Group.
Click the Year Group selection dropdown and click Multiple selections at the bottom of the list.
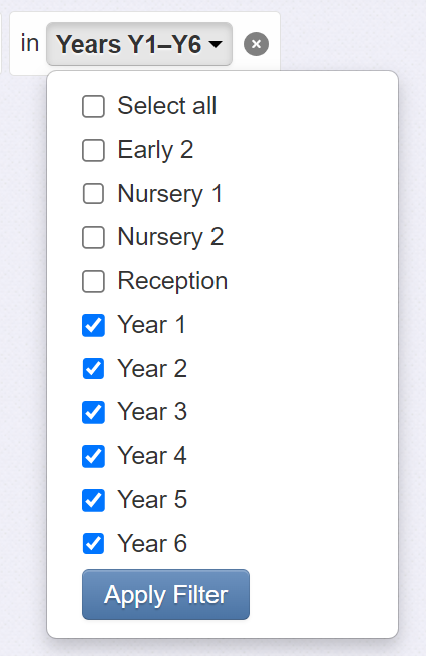
This allows you to select more than one year group. Here, we'll select years 1 to 6, then click Apply Filter.
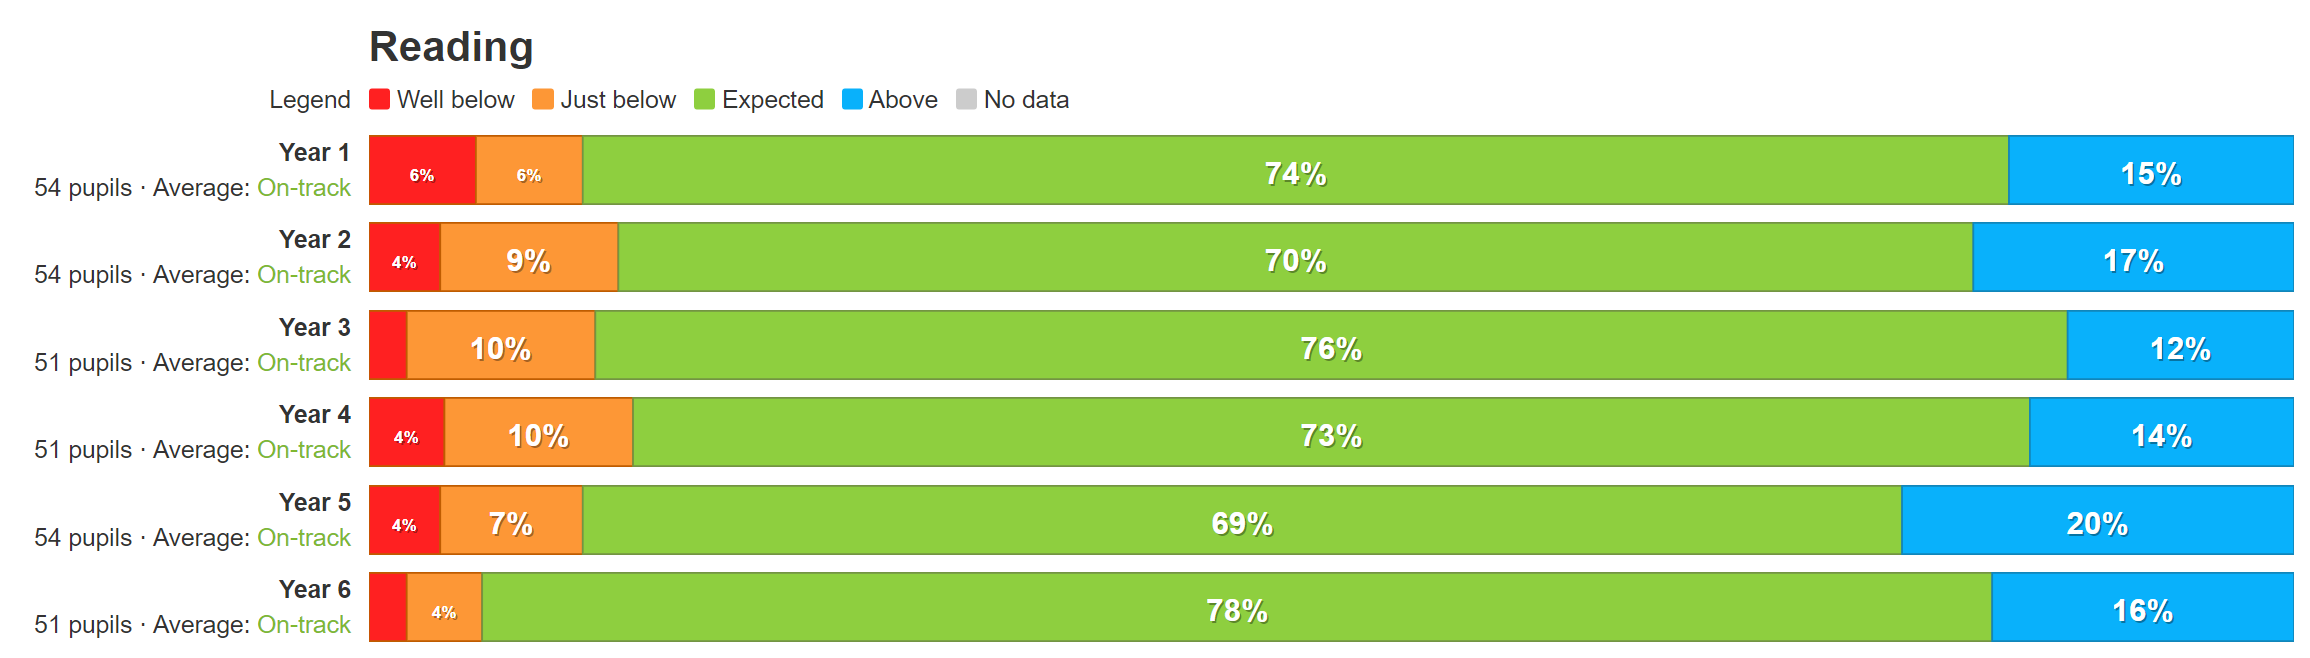
The report is now showing all of key stages one and two (note the number of pupils shown beside each bar). It's often useful at this point to show how each year group compares. To do this, we use the Group Pupils option, selecting the Year Group option from the bottom of the dropdown list. This will take our view and break it down into separate year groups for each subject.
In the Advanced Options, you can opt to view grouped data either by 'Assessments, then pupil groups' (the default shown above), or by 'Pupil groups, then assessments'. Switching views for this particular scenario lets you see each year group's results in all subjects together.
Comparing Early Years with older year groups
The EYFS Aspects are not directly comparable with older key stages, as their focus and curriculum differs. However, it can be useful to see Reception side by side with other year groups.
To enable this for Reading, Writing and Maths Insight will use the following Early Years Aspects:
Reading - Whichever is the lower of Word Reading and Comprehension
Writing - Writing
Maths - Whichever is the lower of Number or Numerical Patterns
(If an early years pupil has standard Reading or Maths assessments, these will be displayed)
Other types of assessment
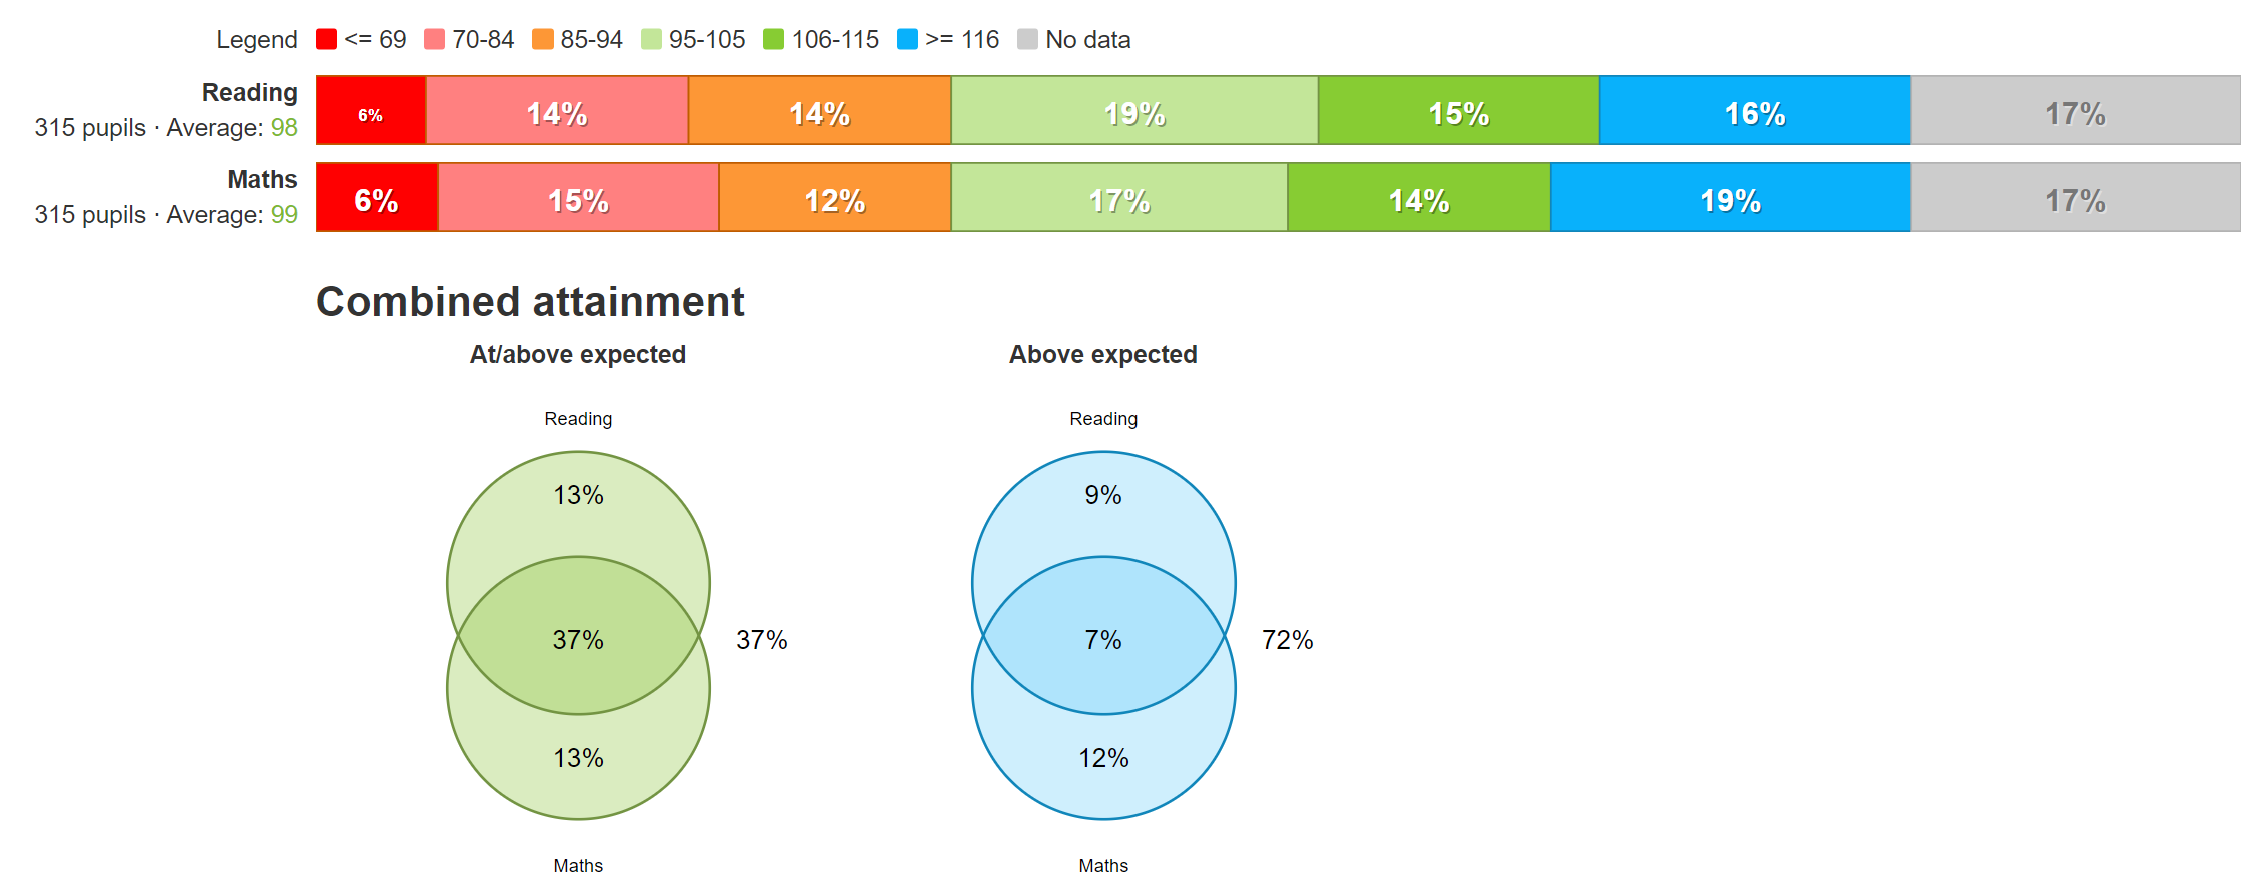
So far we've been dealing with teacher assessment, but we can use this report to investigate other types of assessment as well. Here's an example of a report summarising year 5's summer attainment in a set of standardised tests.
Here we may want to take advantage of another setting under Advanced Options. If you have more than four assessment categories, you can get a more detailed view of your data by clicking on Advanced Options and changing the Compare setting to Detailed breakdown.
Download and Print
If you want to send the report to someone, you can download it as a pdf. Click the Print button and choose Save as PDF. The latter is recommended for emailing and sharing with governors.