Progress Matrix report
 Updated
Progress matrices are a simple yet powerful tool for quickly visualising a cohort’s progress between two points or comparing outcomes in different subjects and assessments. They are great way to monitor rather than measure progress.
Progress Matrices are fully interactive, work with a range of data, and can be made anonymous for audiences such as governors. They are particularly useful as a start point for discussion during pupil progress meetings.
In this help guide you will learn to:
- Build a simple progress matrix from KS1 using teacher assessment data
- Change the start and end points and apply filters
- Use different types of assessment data
- Compare different types of assessment data for a single point in time
- Compare results in one subject against another
- Compare current assessments to future targets
- Add group indicators to a progress matrix
- Remove pupil names for Governors
The basics
To access the report, click on the Reports menu and select Progress Matrix.
This will bring up the Progress Matrix builder and a default report as follows:
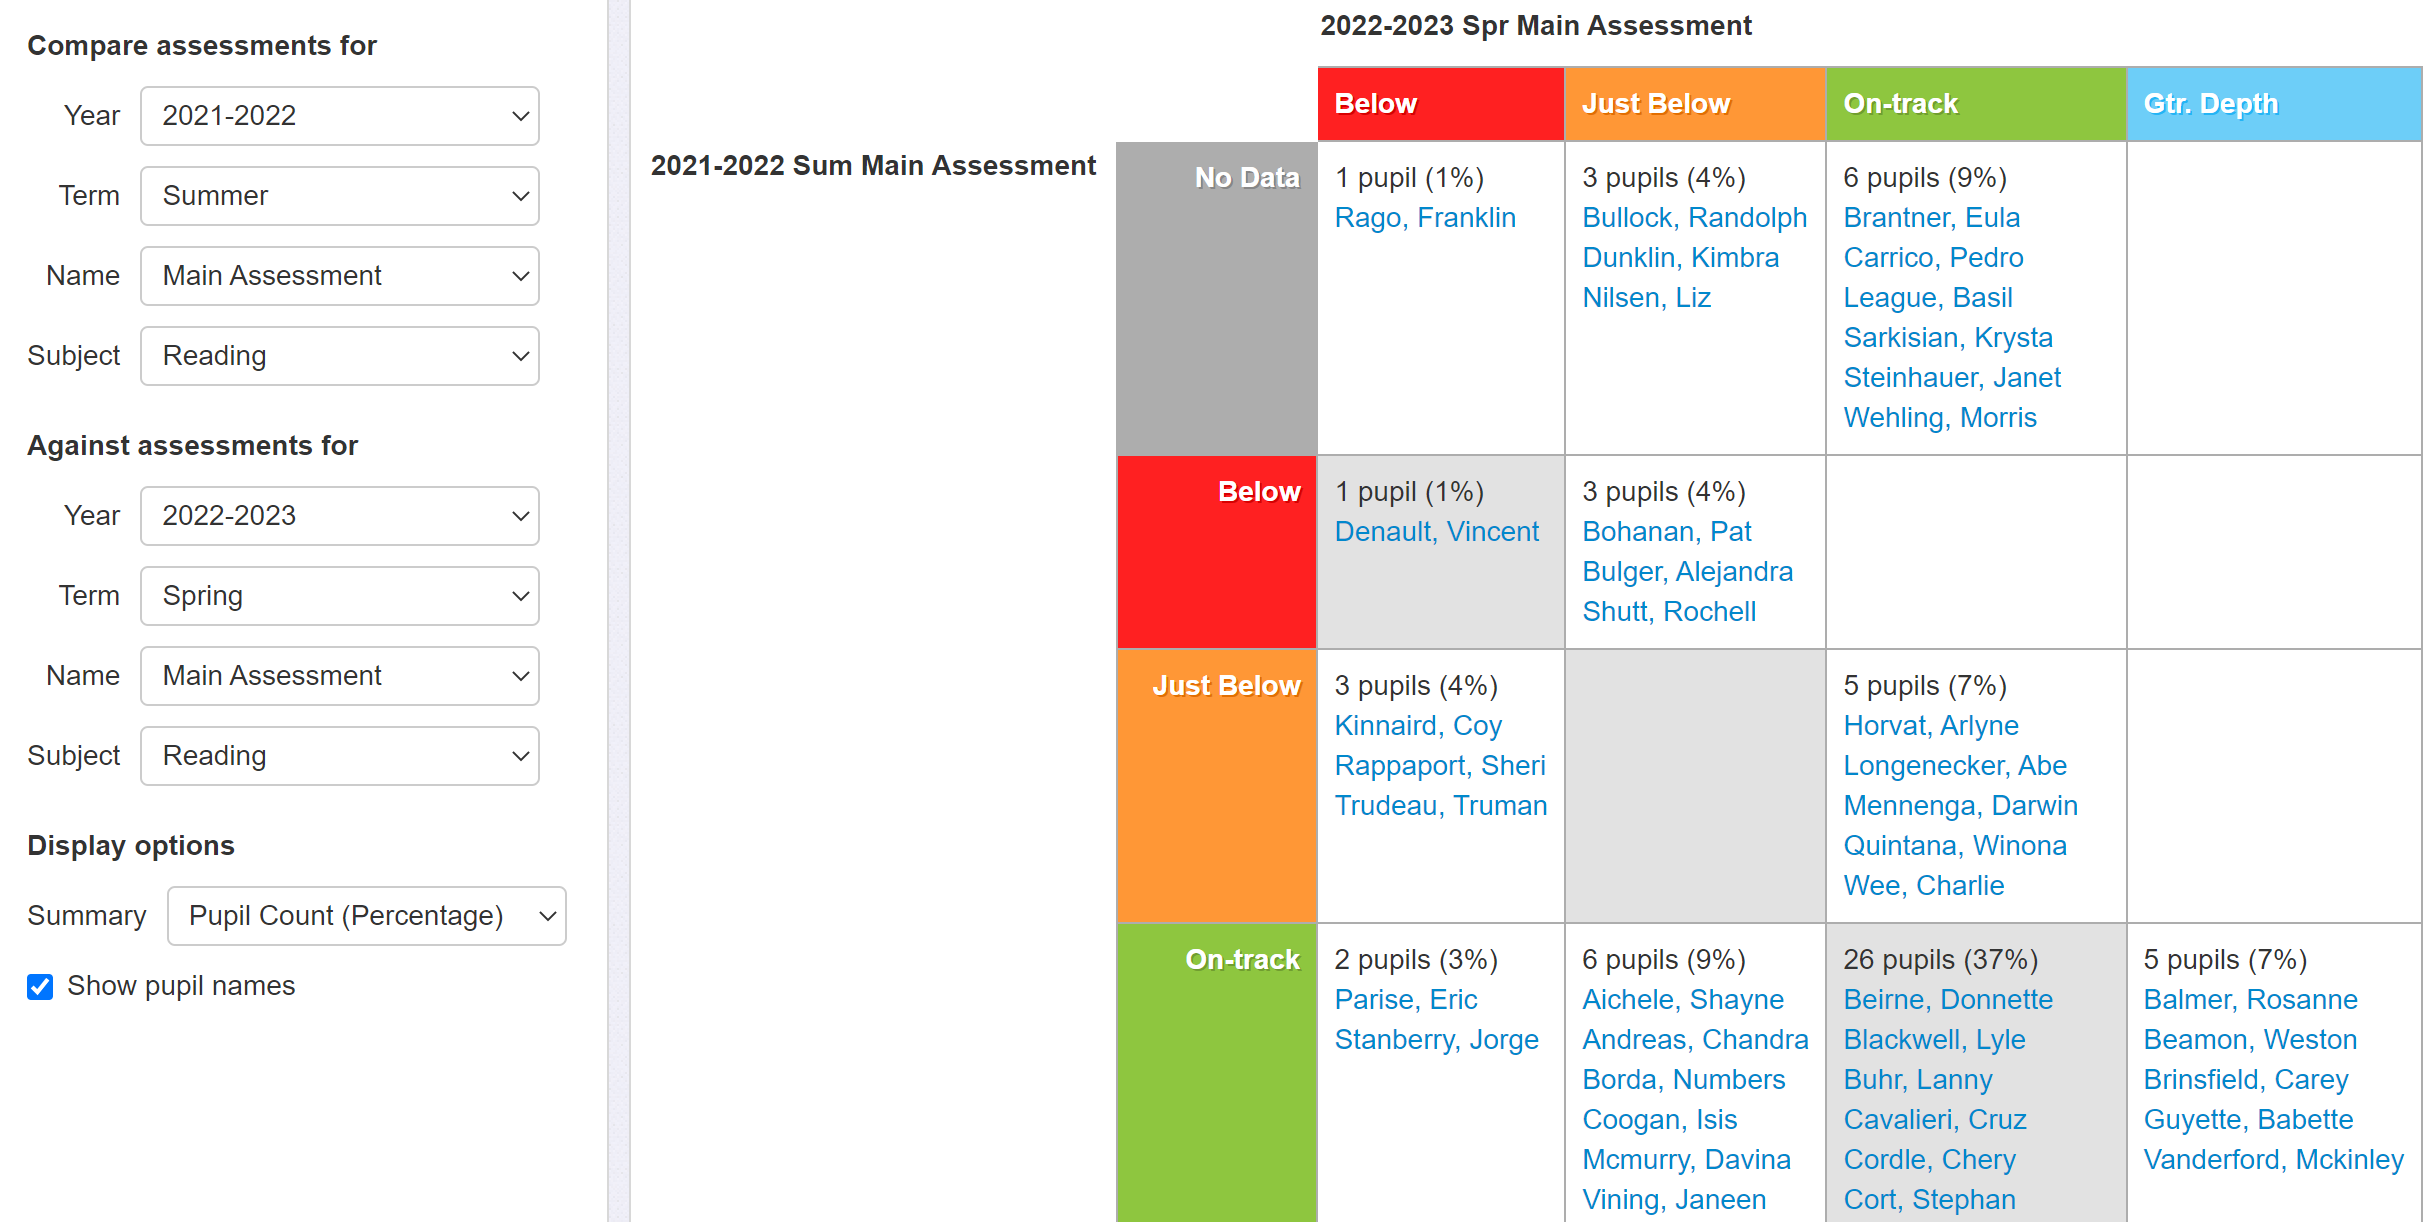
Note the drop-down menus across the top of the screen for selecting academic year and cohort and for applying filters to remove groups or specific pupils. The controls for building the Progress Matrix are found in the left-hand sidebar. By default, the report uses the 'Main Assessment' (usually your teacher assessment) in Reading; and the date parameters are set as follows:
Start point: previous academic year, summer term
End point: current academic year, current term
Often, showing the full list of names can be unnecessary, or even distracting. The names you're more likely to want to see are those who have converted from, say, On Track to Just Below or similar.
Unticking Show Pupil Names then allows you to click in the cells for the names you want to see on screen.
The Display Options also let you choose how, and what, numbers you want to display. For example, you may prefer to show the percentage first, and then the pupil count. This is especially useful when you have large pupil numbers.
Tailoring your report
Now let’s get a different view of our data!
Here we’re going to investigate the progress made by Year 5 boys in Writing between KS1 and the assessment for the Spring term. This requires changing the Year Group, the start and end point, and the subject, as well as applying a filter.
To do this we need to make the following changes:
- Year 5 selected from year group drop-down
- A Gender filter applied via the Filter Pupils drop-down, and Boys selected
- In the ‘Compare assessments for’ options, Year 2 / Summer / SAT TA is selected to set the start point to KS1 (SAT TA is the statutory teacher assessment)
- In the ‘Against assessment for’, the Spring term is selected to move the end point back a term
- Writing is selected in both subject fields
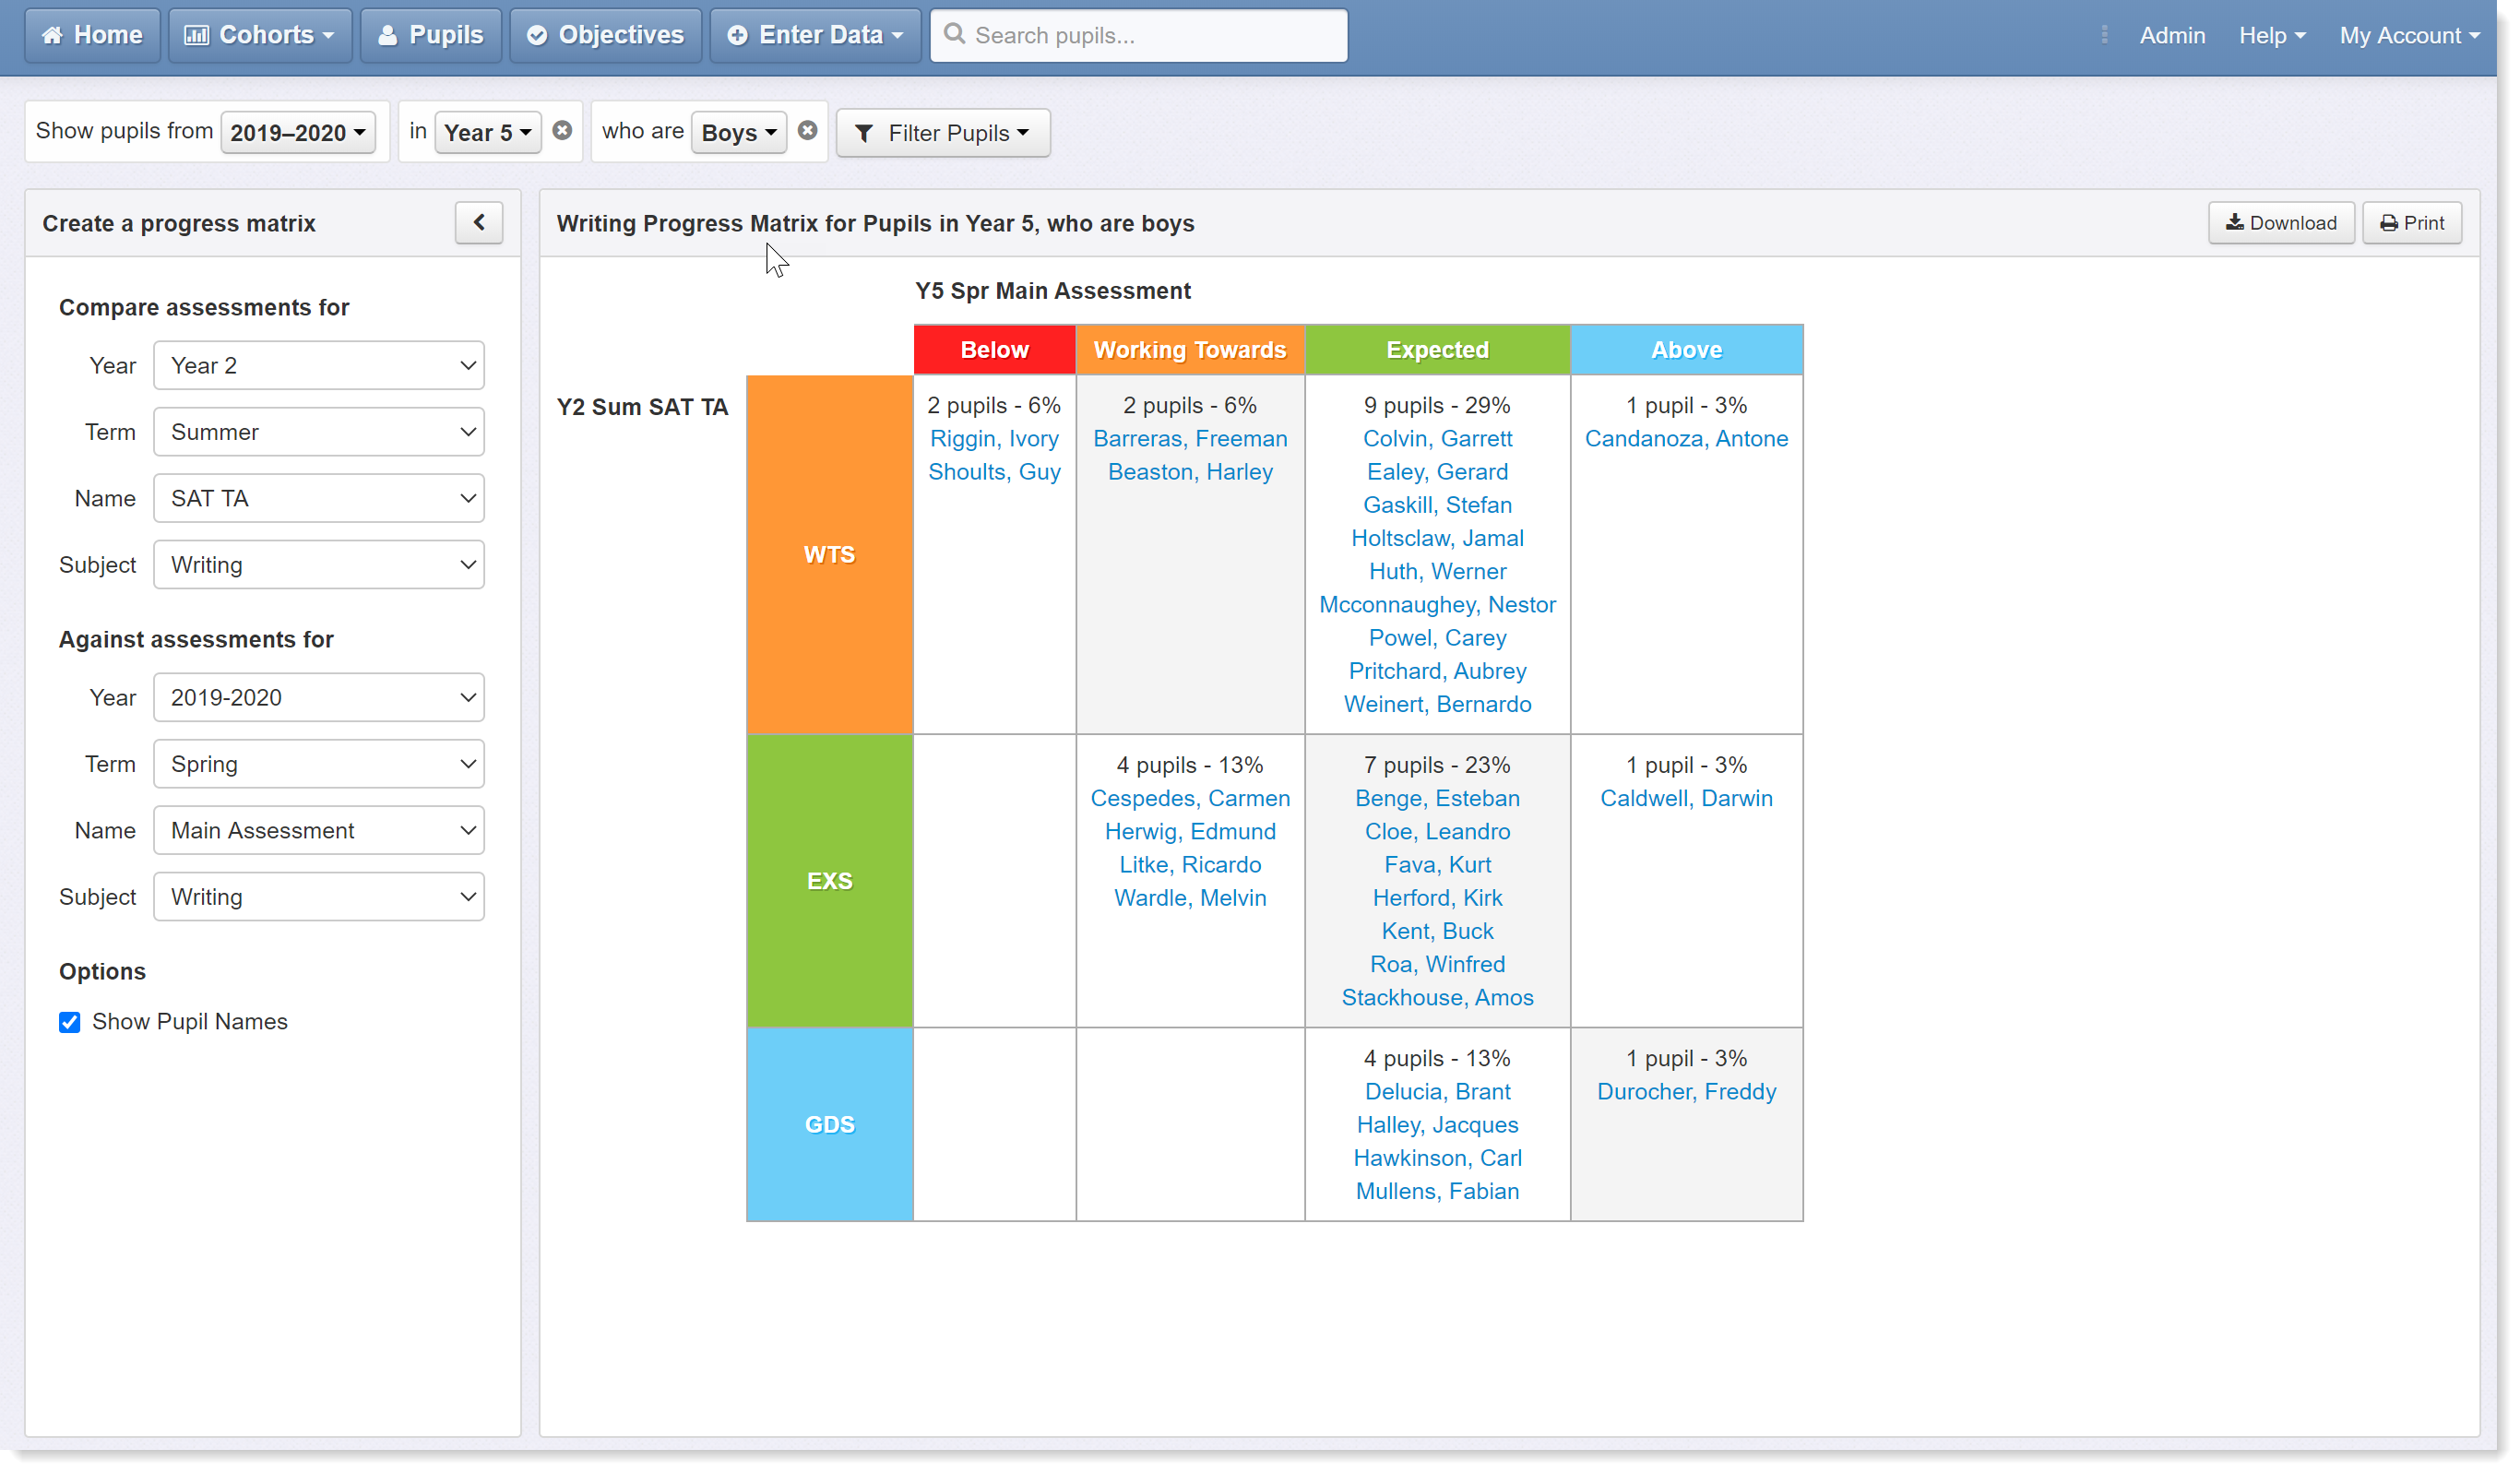
And here's the result! Now we can compare boys’ latest writing assessments to their KS1 results.
Using different types of assessment data
The Progress Matrix is not limited to working with teacher assessment-style data. We can also use test scores, or any other type of data you record in the system (Book Bands, objective summaries, etc).
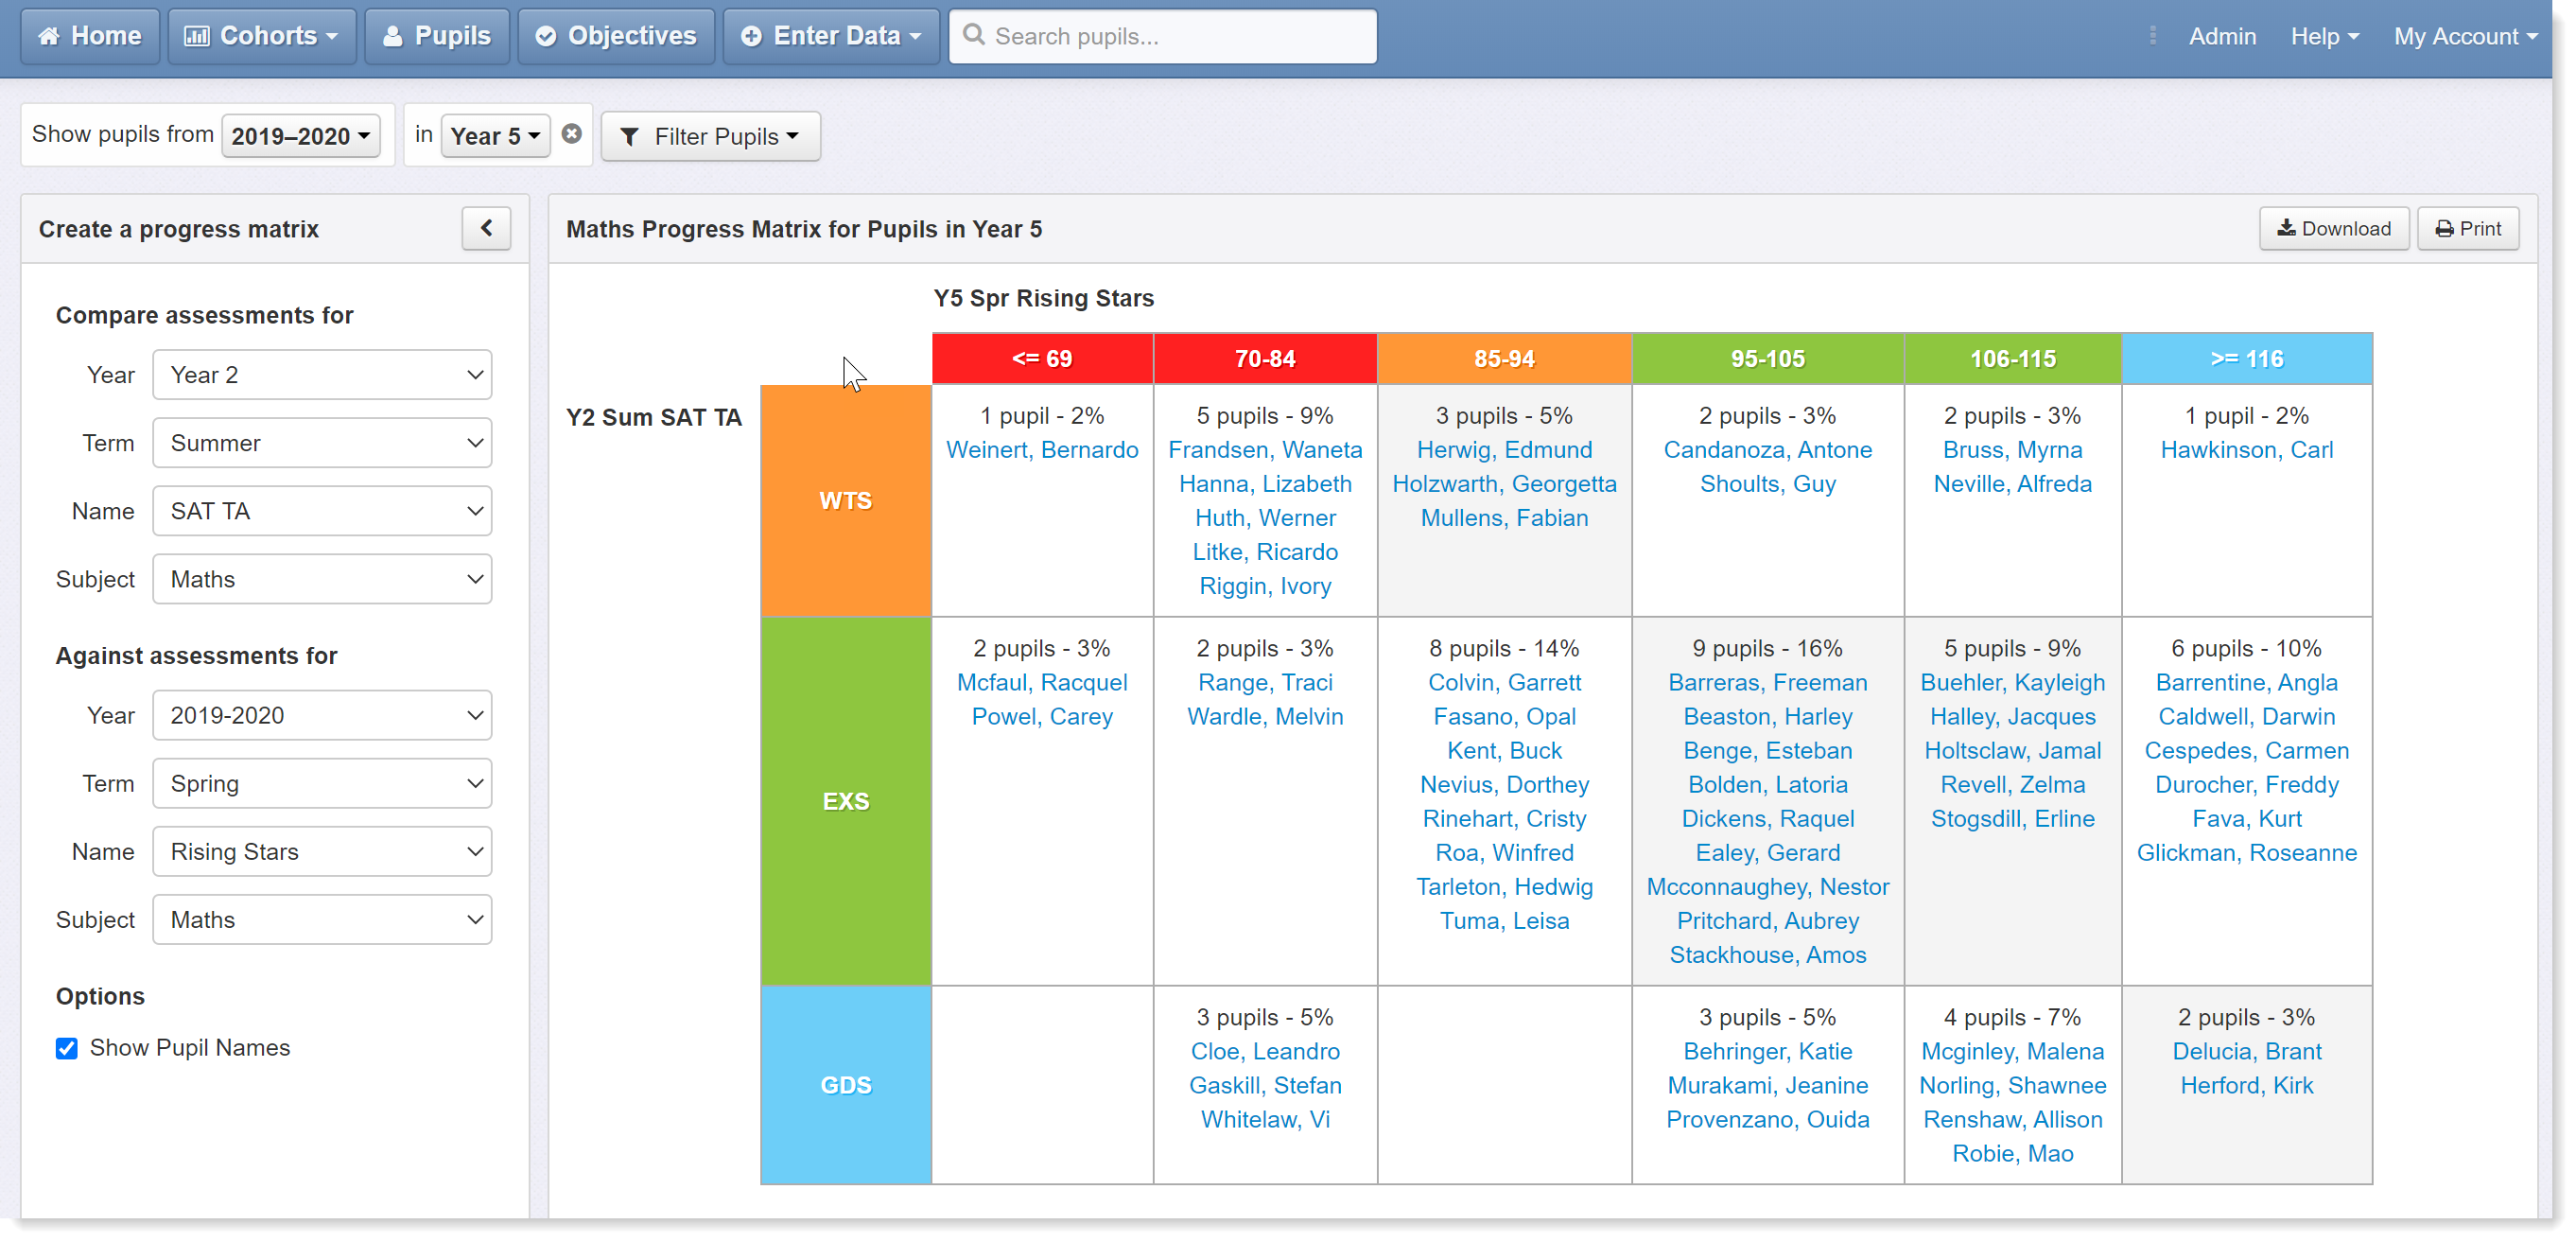
In this example we are still dealing with Year 5 and the start point remains at KS1 ('SAT TA' – teacher assessment) but the subject is changed to Maths and ‘Main Assessment’ has been swapped for Rising Stars. We've also removed the Gender filter to return to a whole year view.
We are now comparing our Year 5 pupils’ Maths results between KS1 and a standardised test taken in the Spring term.
Comparing assessments at a single point in time
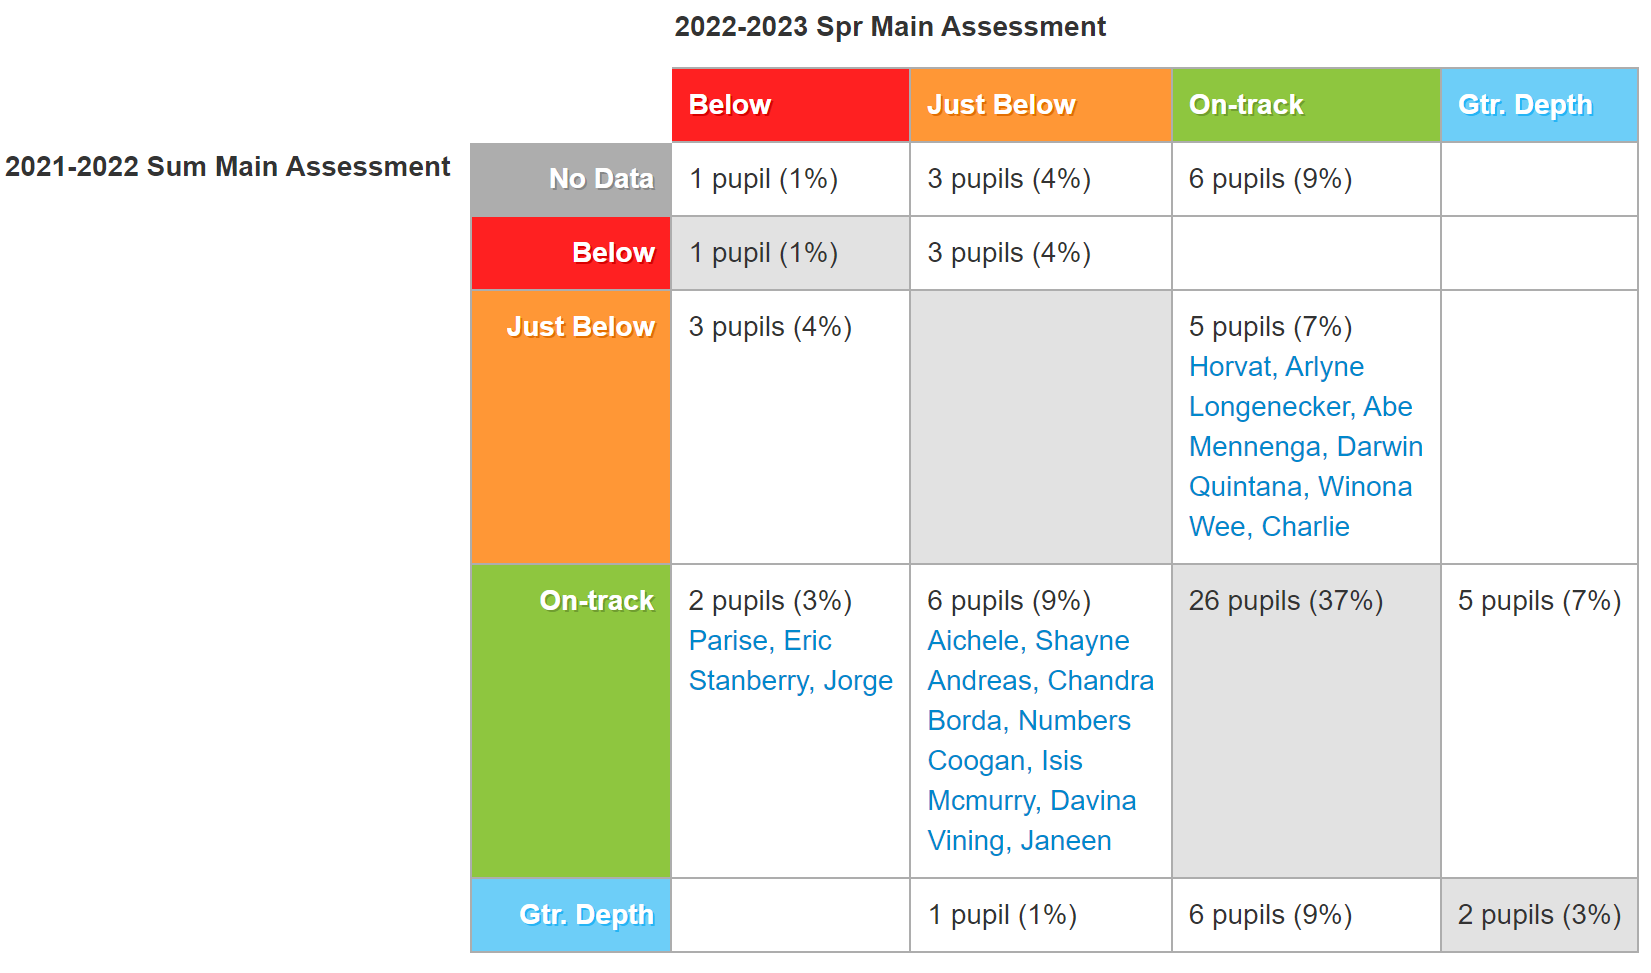
Matrices are not limited to comparing data between two points; they can also be used to compare assessments and subjects at single point in time to spot any discrepancies in current performance.
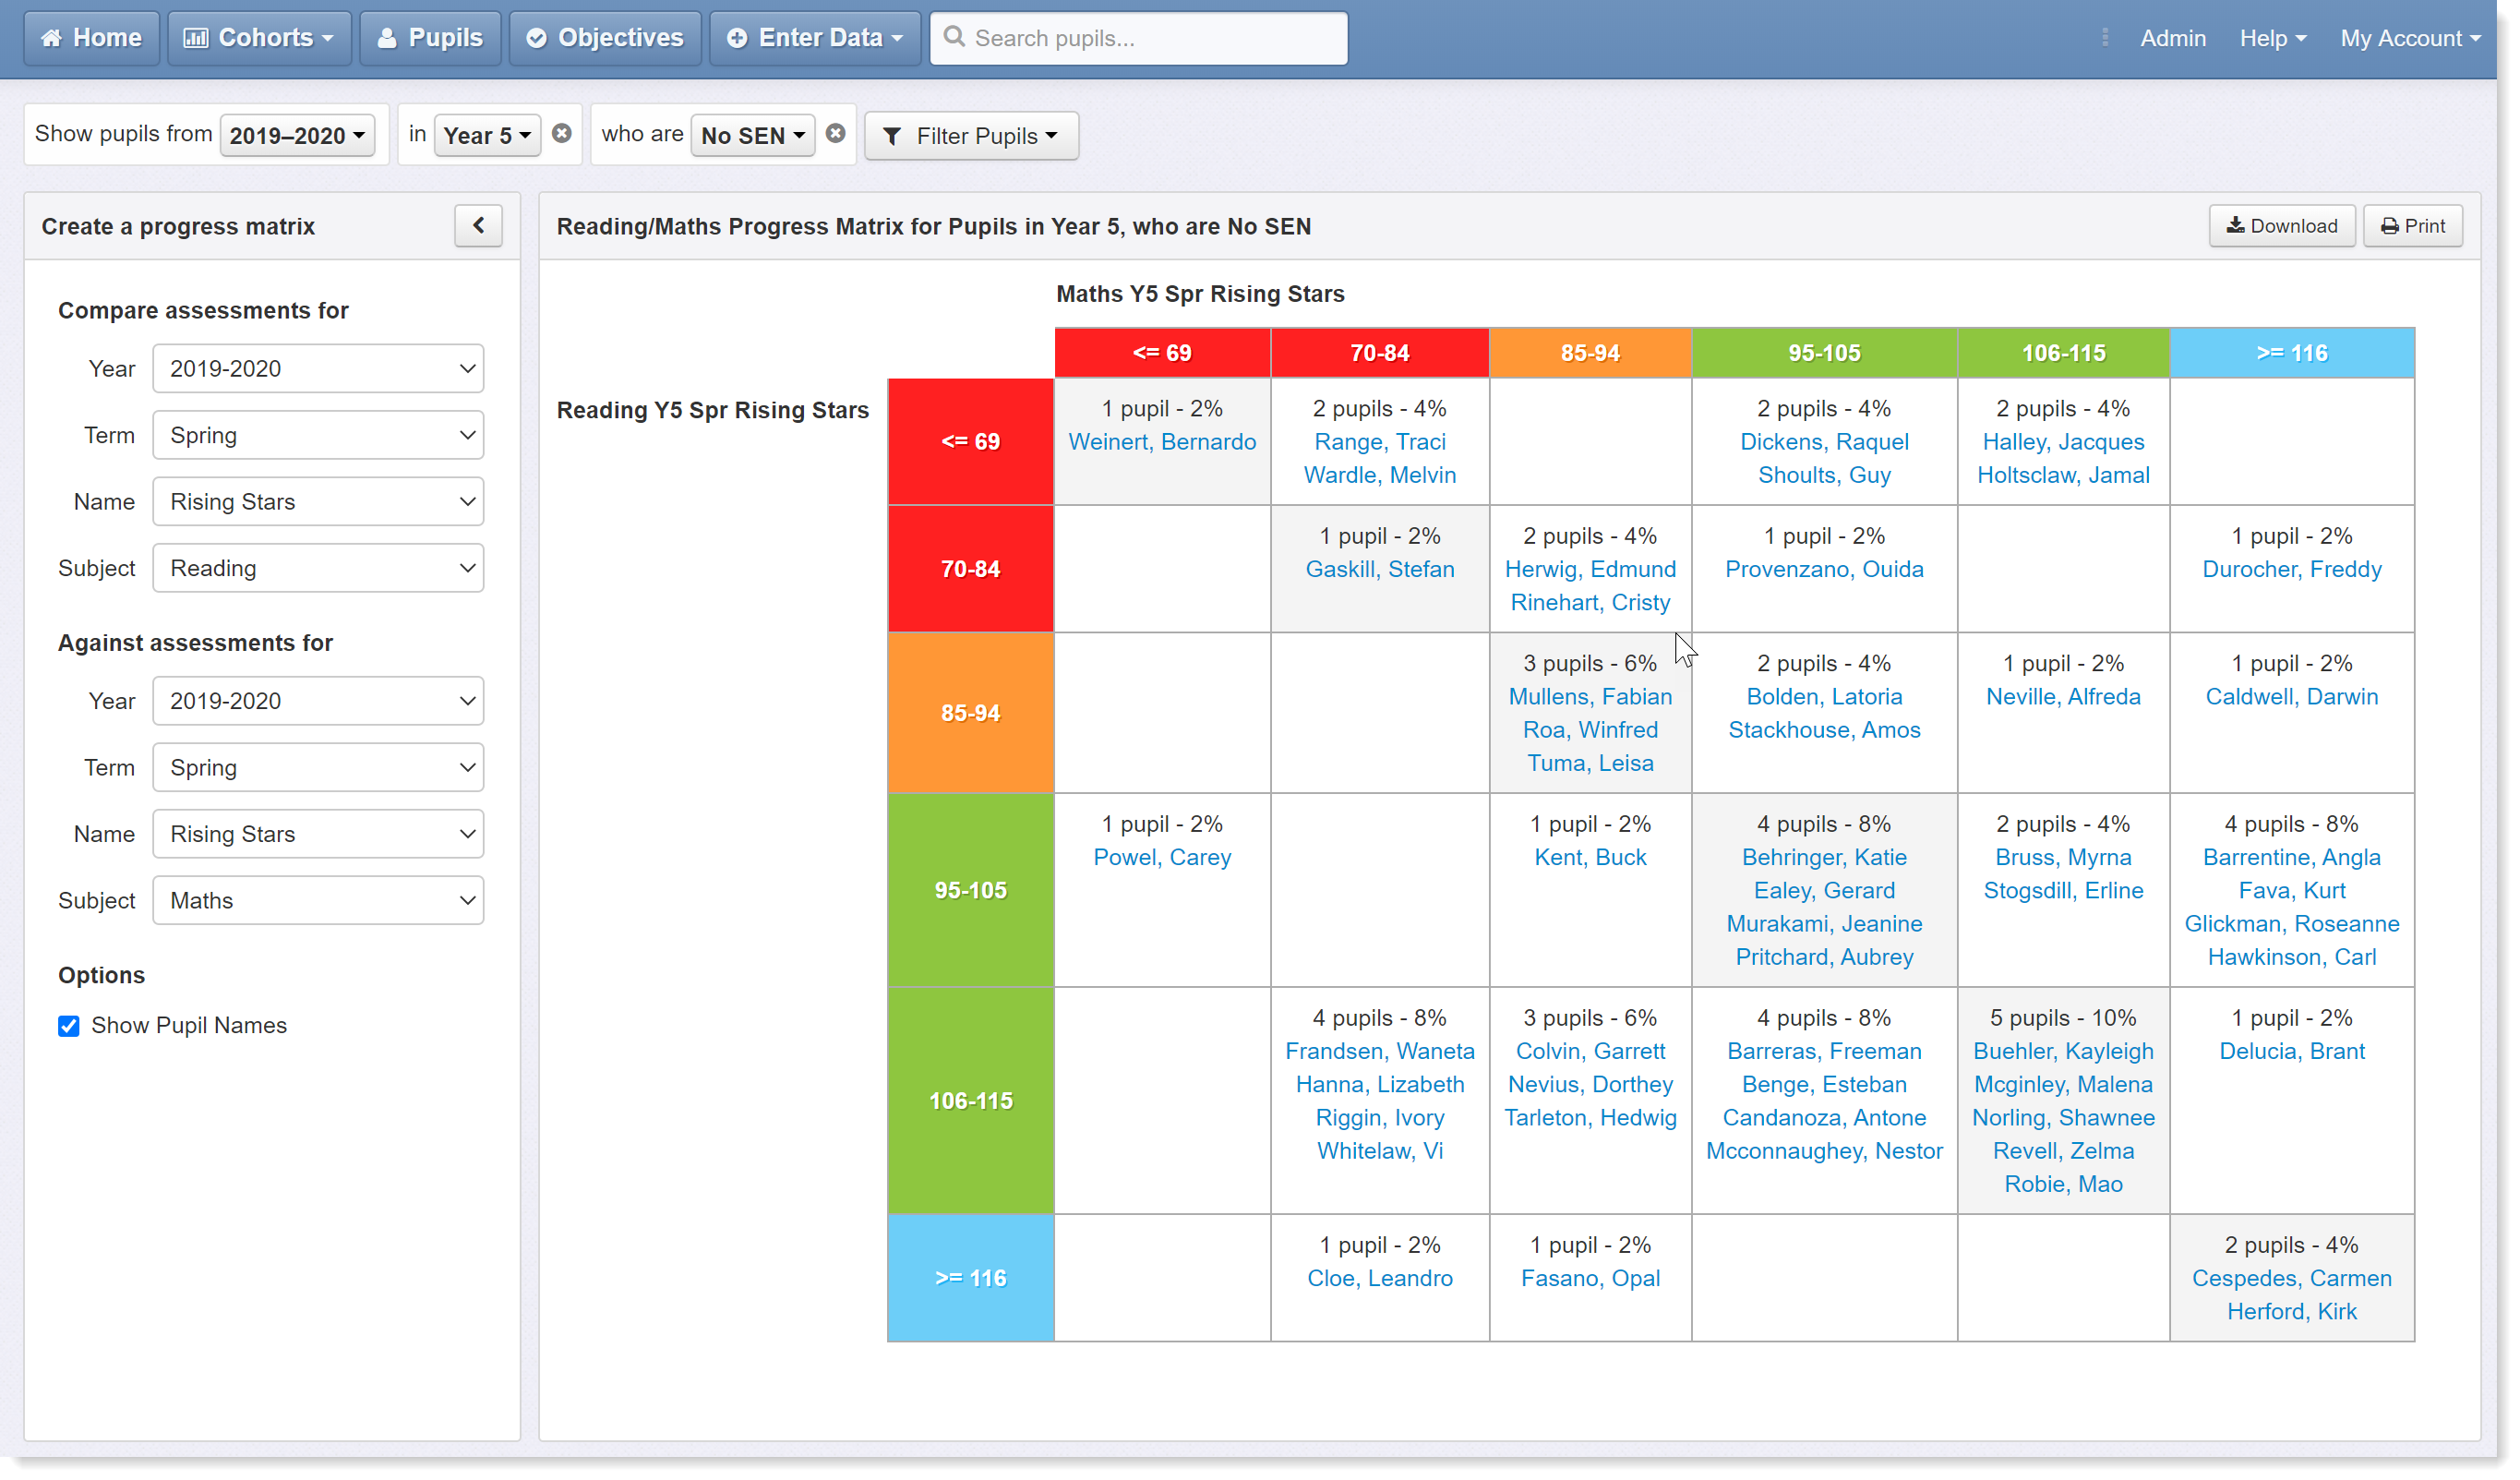
This example compares the results of a Spring term standardised test in Reading and Maths. We might expect to see broad alignment between subjects but here we can quickly spot anomalies such as those pupils with relatively high scores in Reading but low scores in Maths. Note: a SEND filter has been applied and the report is focusing on non-SEND only.
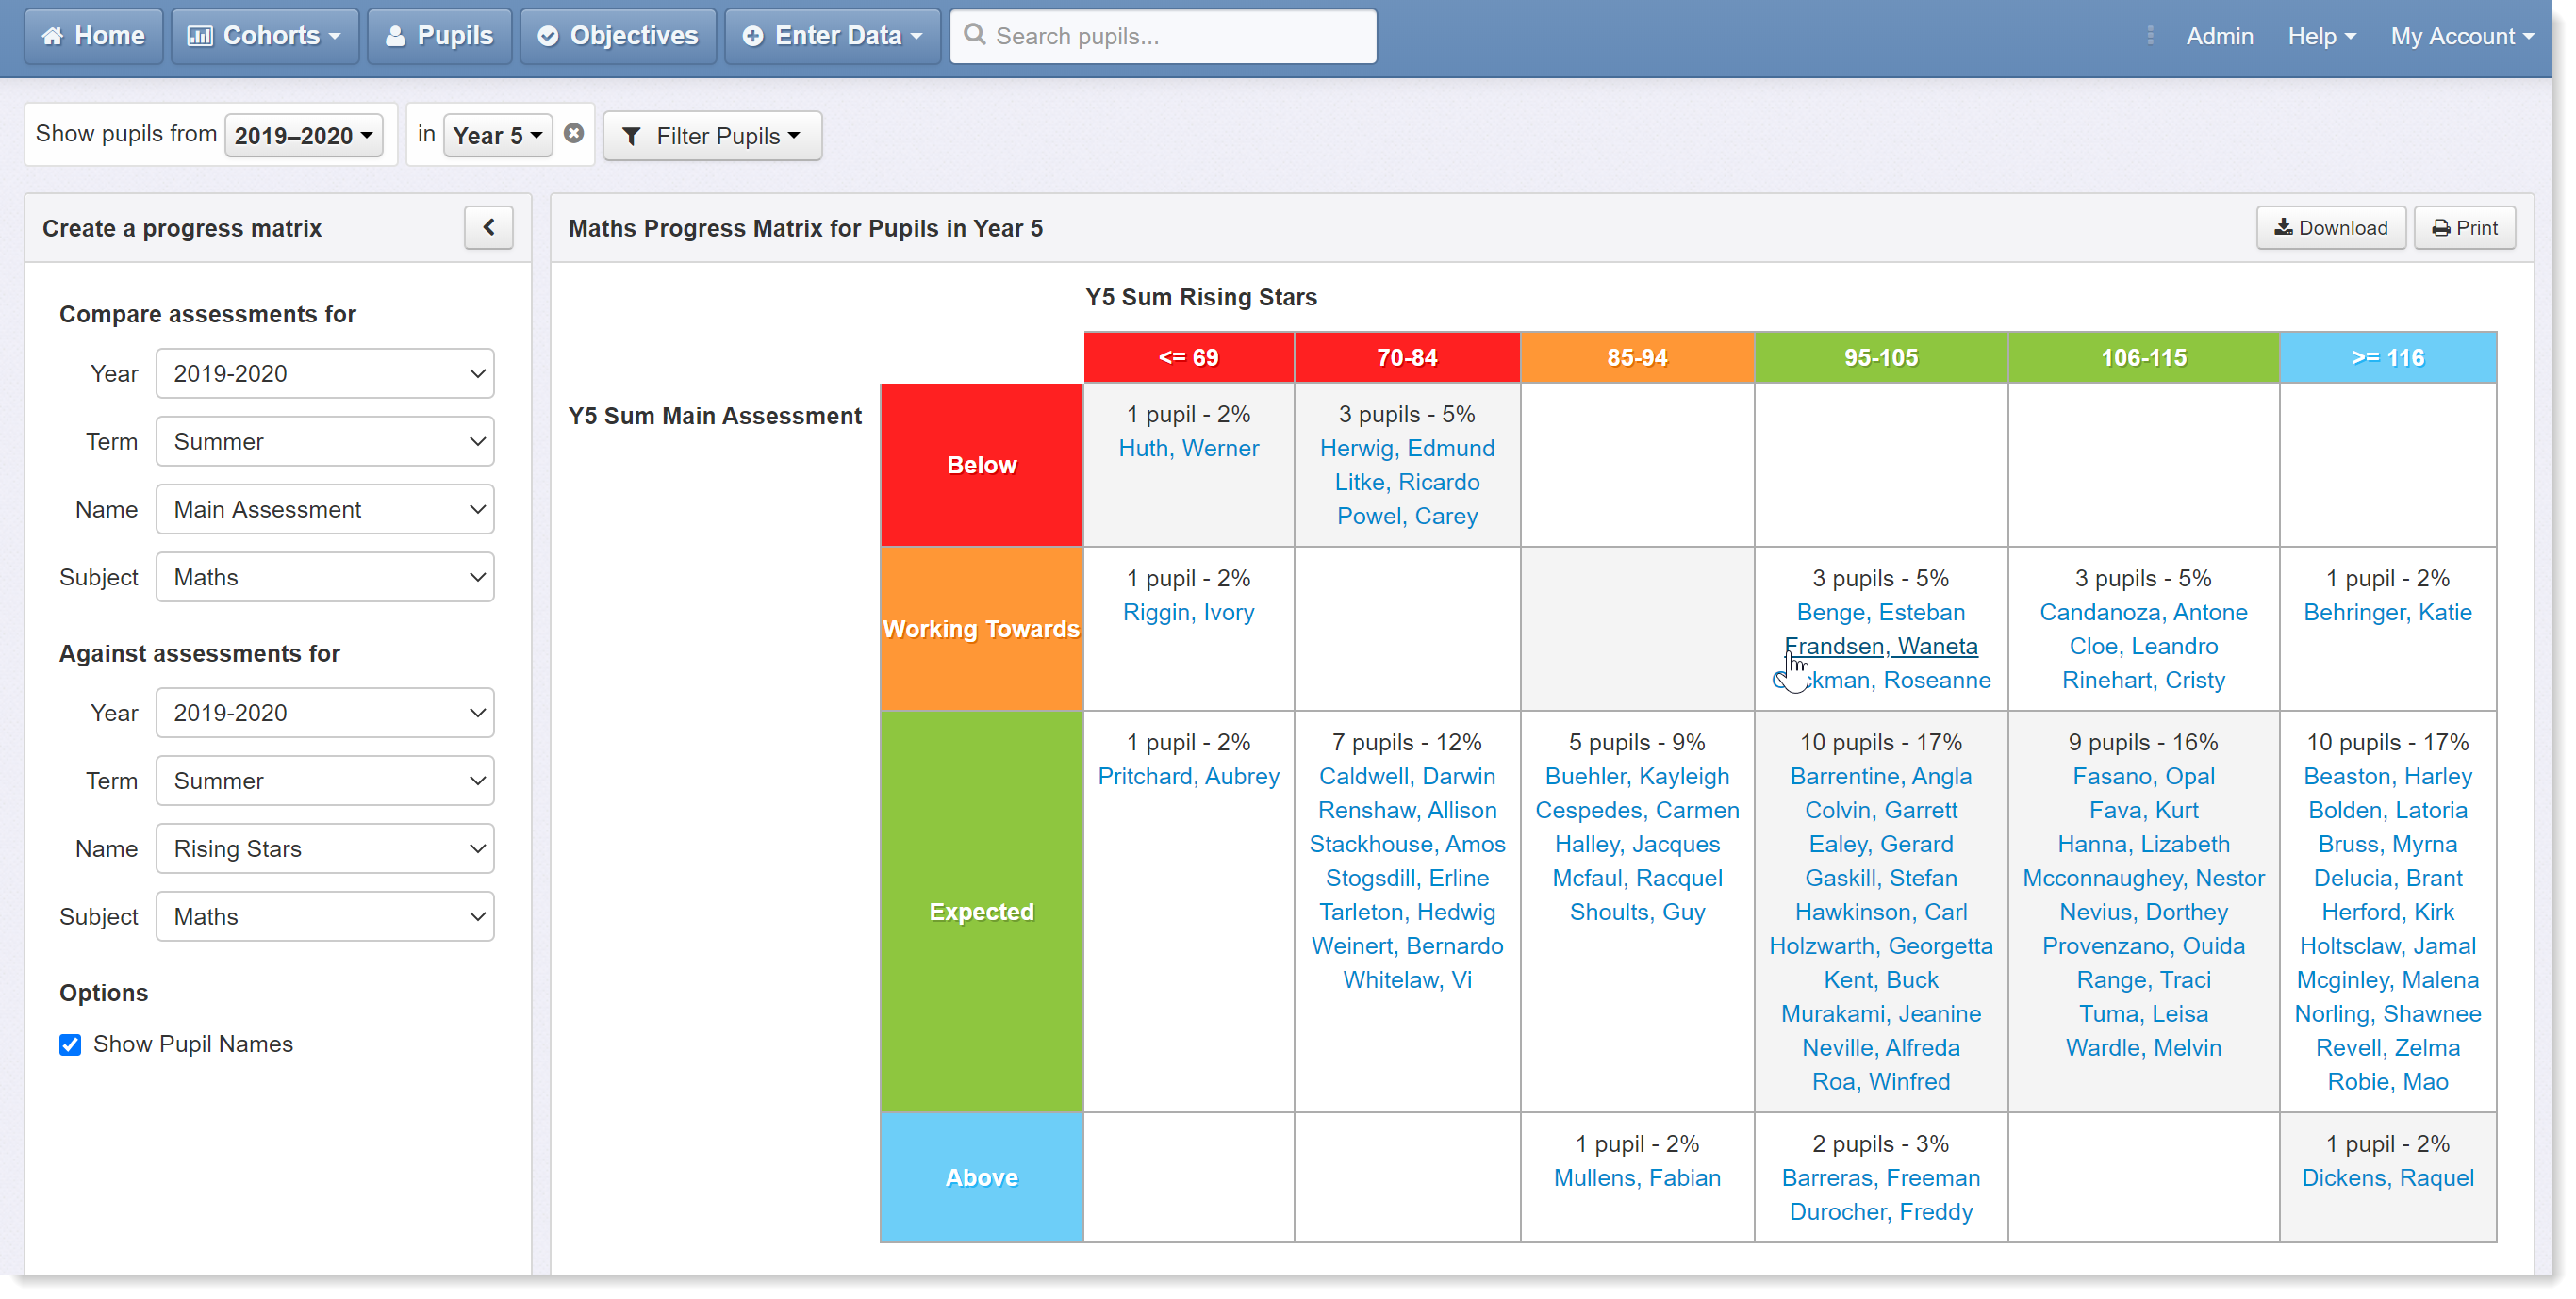
In this next example, we are comparing the end of year teacher assessment and test scores in the same subject - Maths. Again, this can help spot discrepancies, but in this case between assessments rather than subjects. Note: the SEND filter has been removed.
Adding Group Indicators
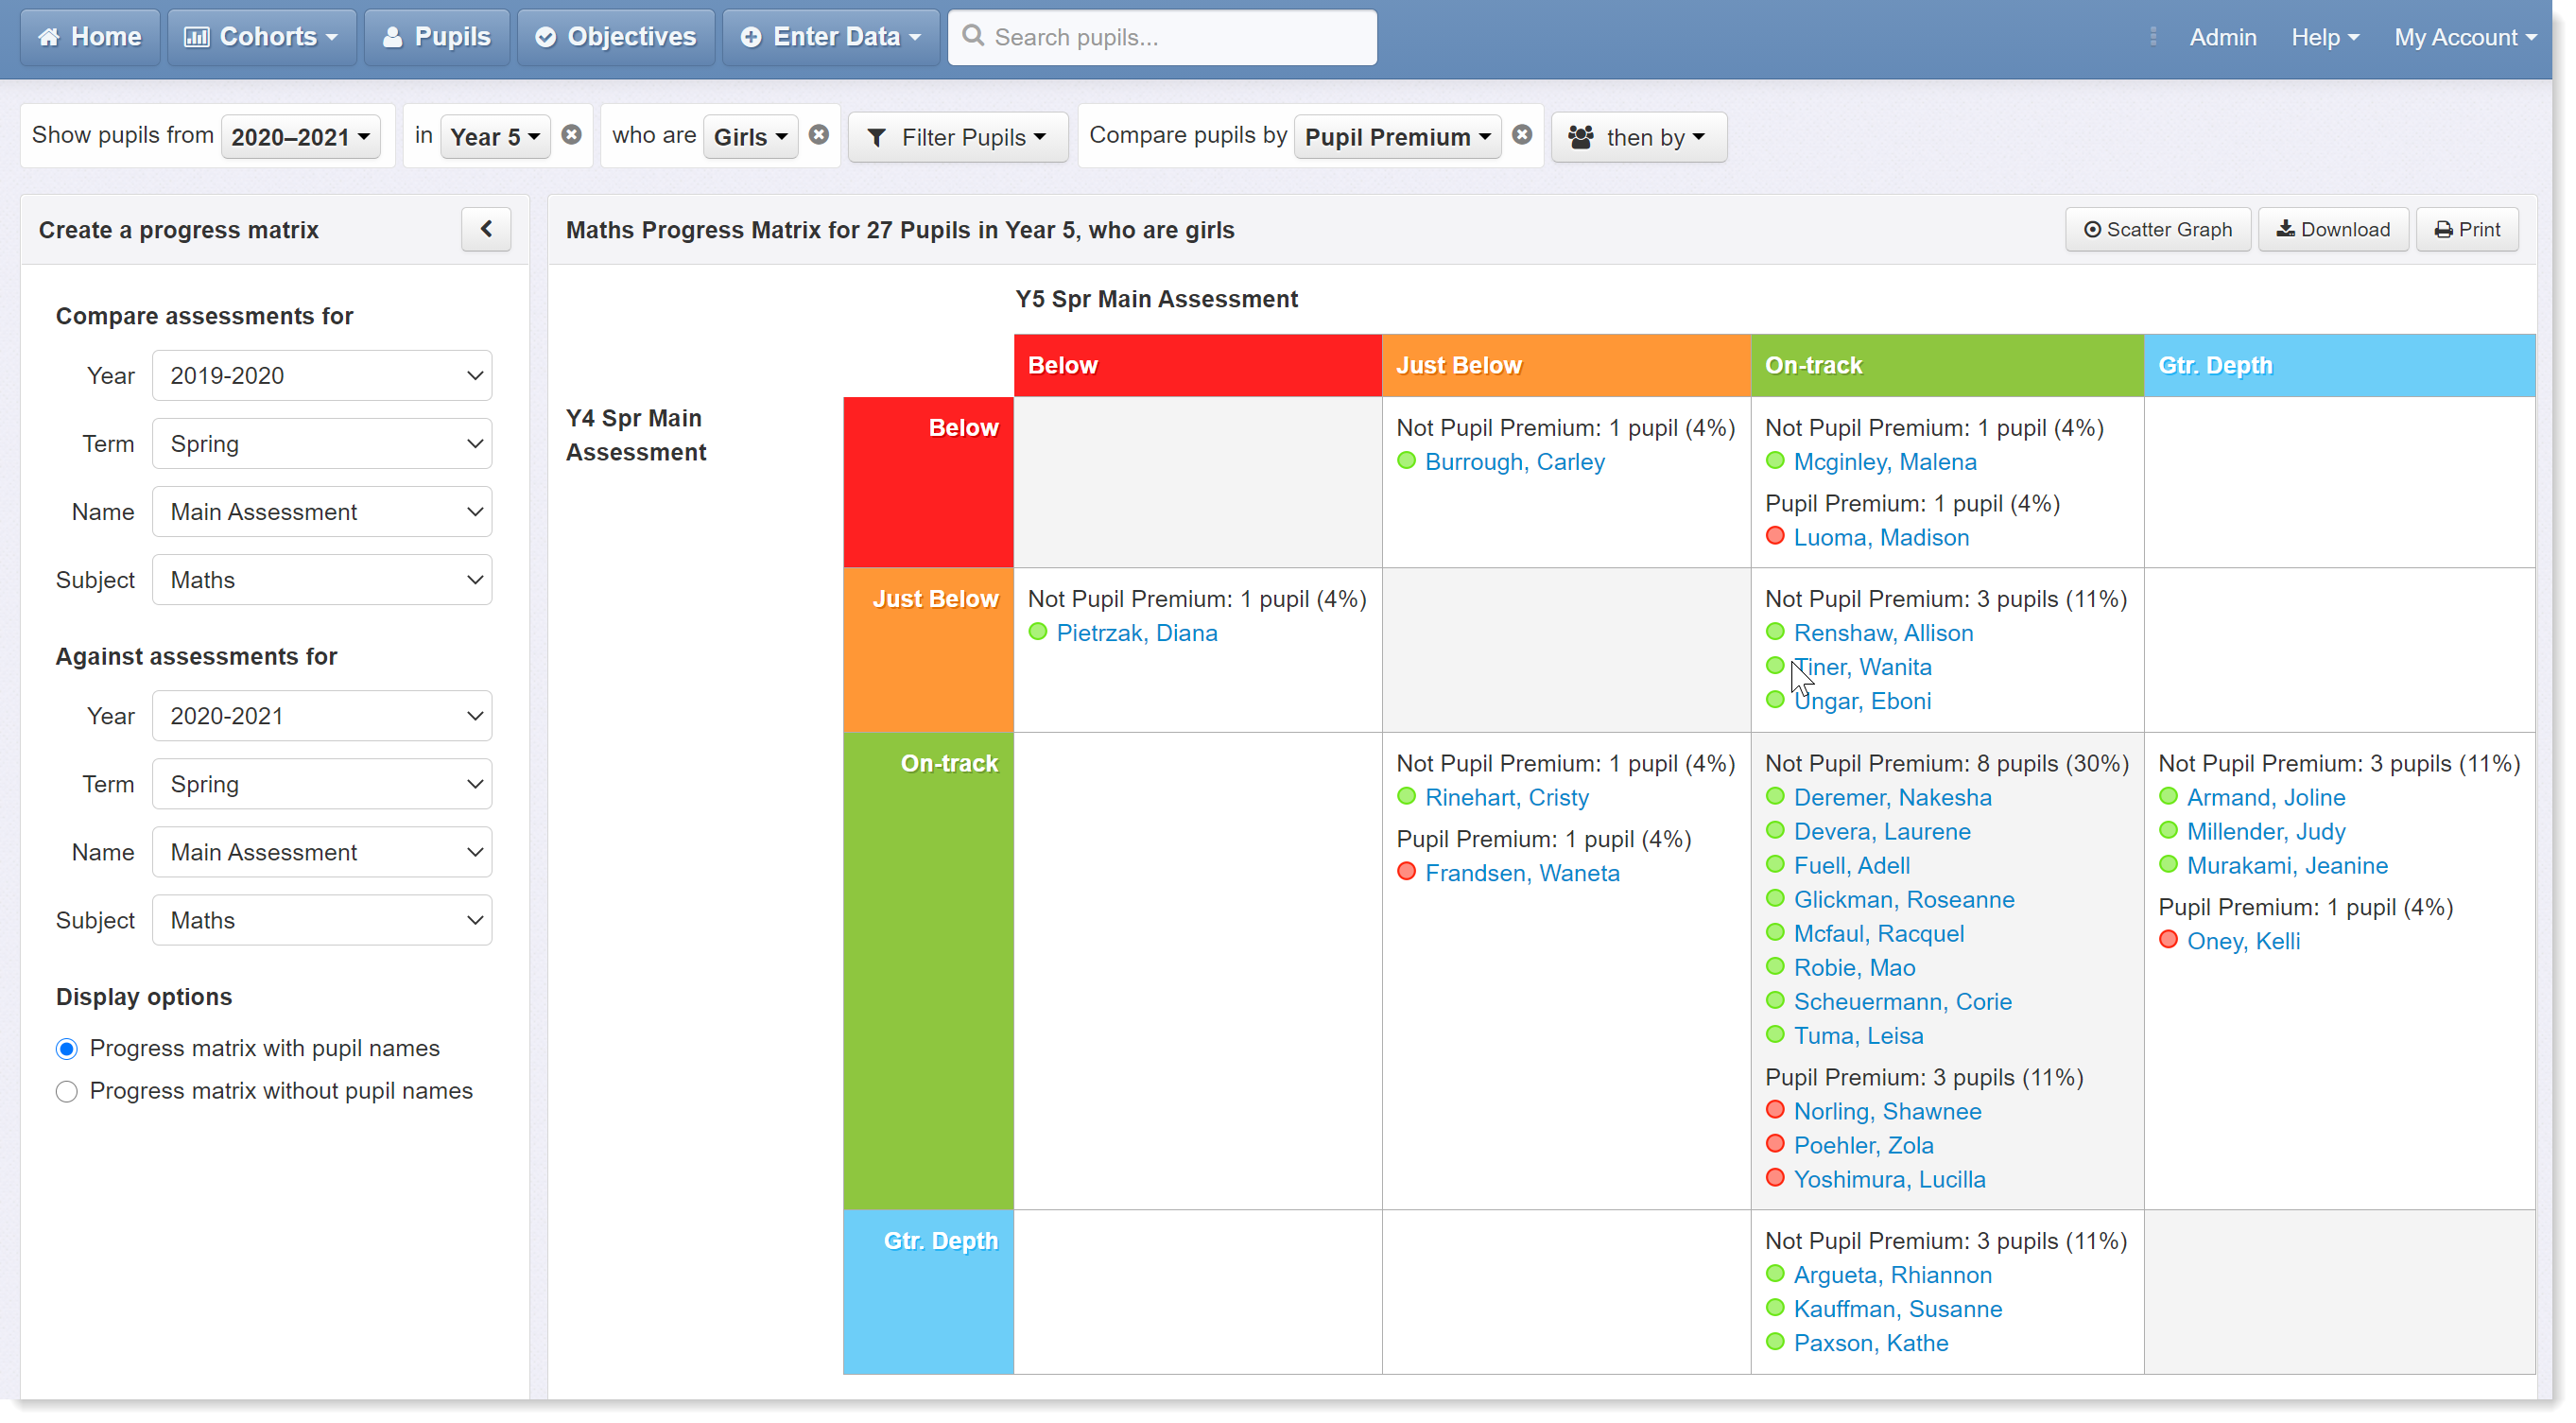
Click on the Group Pupils button to add group indicators to your progress matrix. The following report compares spring term maths assessments this year with those of the previous year for girls in year 5. Pupil Premium has been selected from the Group Pupils menu and pupils are colour coded accordingly.
And what about targets?
With a matrix we can even go forwards in time and compare a current assessment to a future target. Note that we're still looking at Year 5 pupils, but the end point has been set to the end of Year 6 (see ‘Against assessments for’ options in the sidebar). Also note that the matrix is too wide for the screen. To view the whole report, you can hide the side bar.
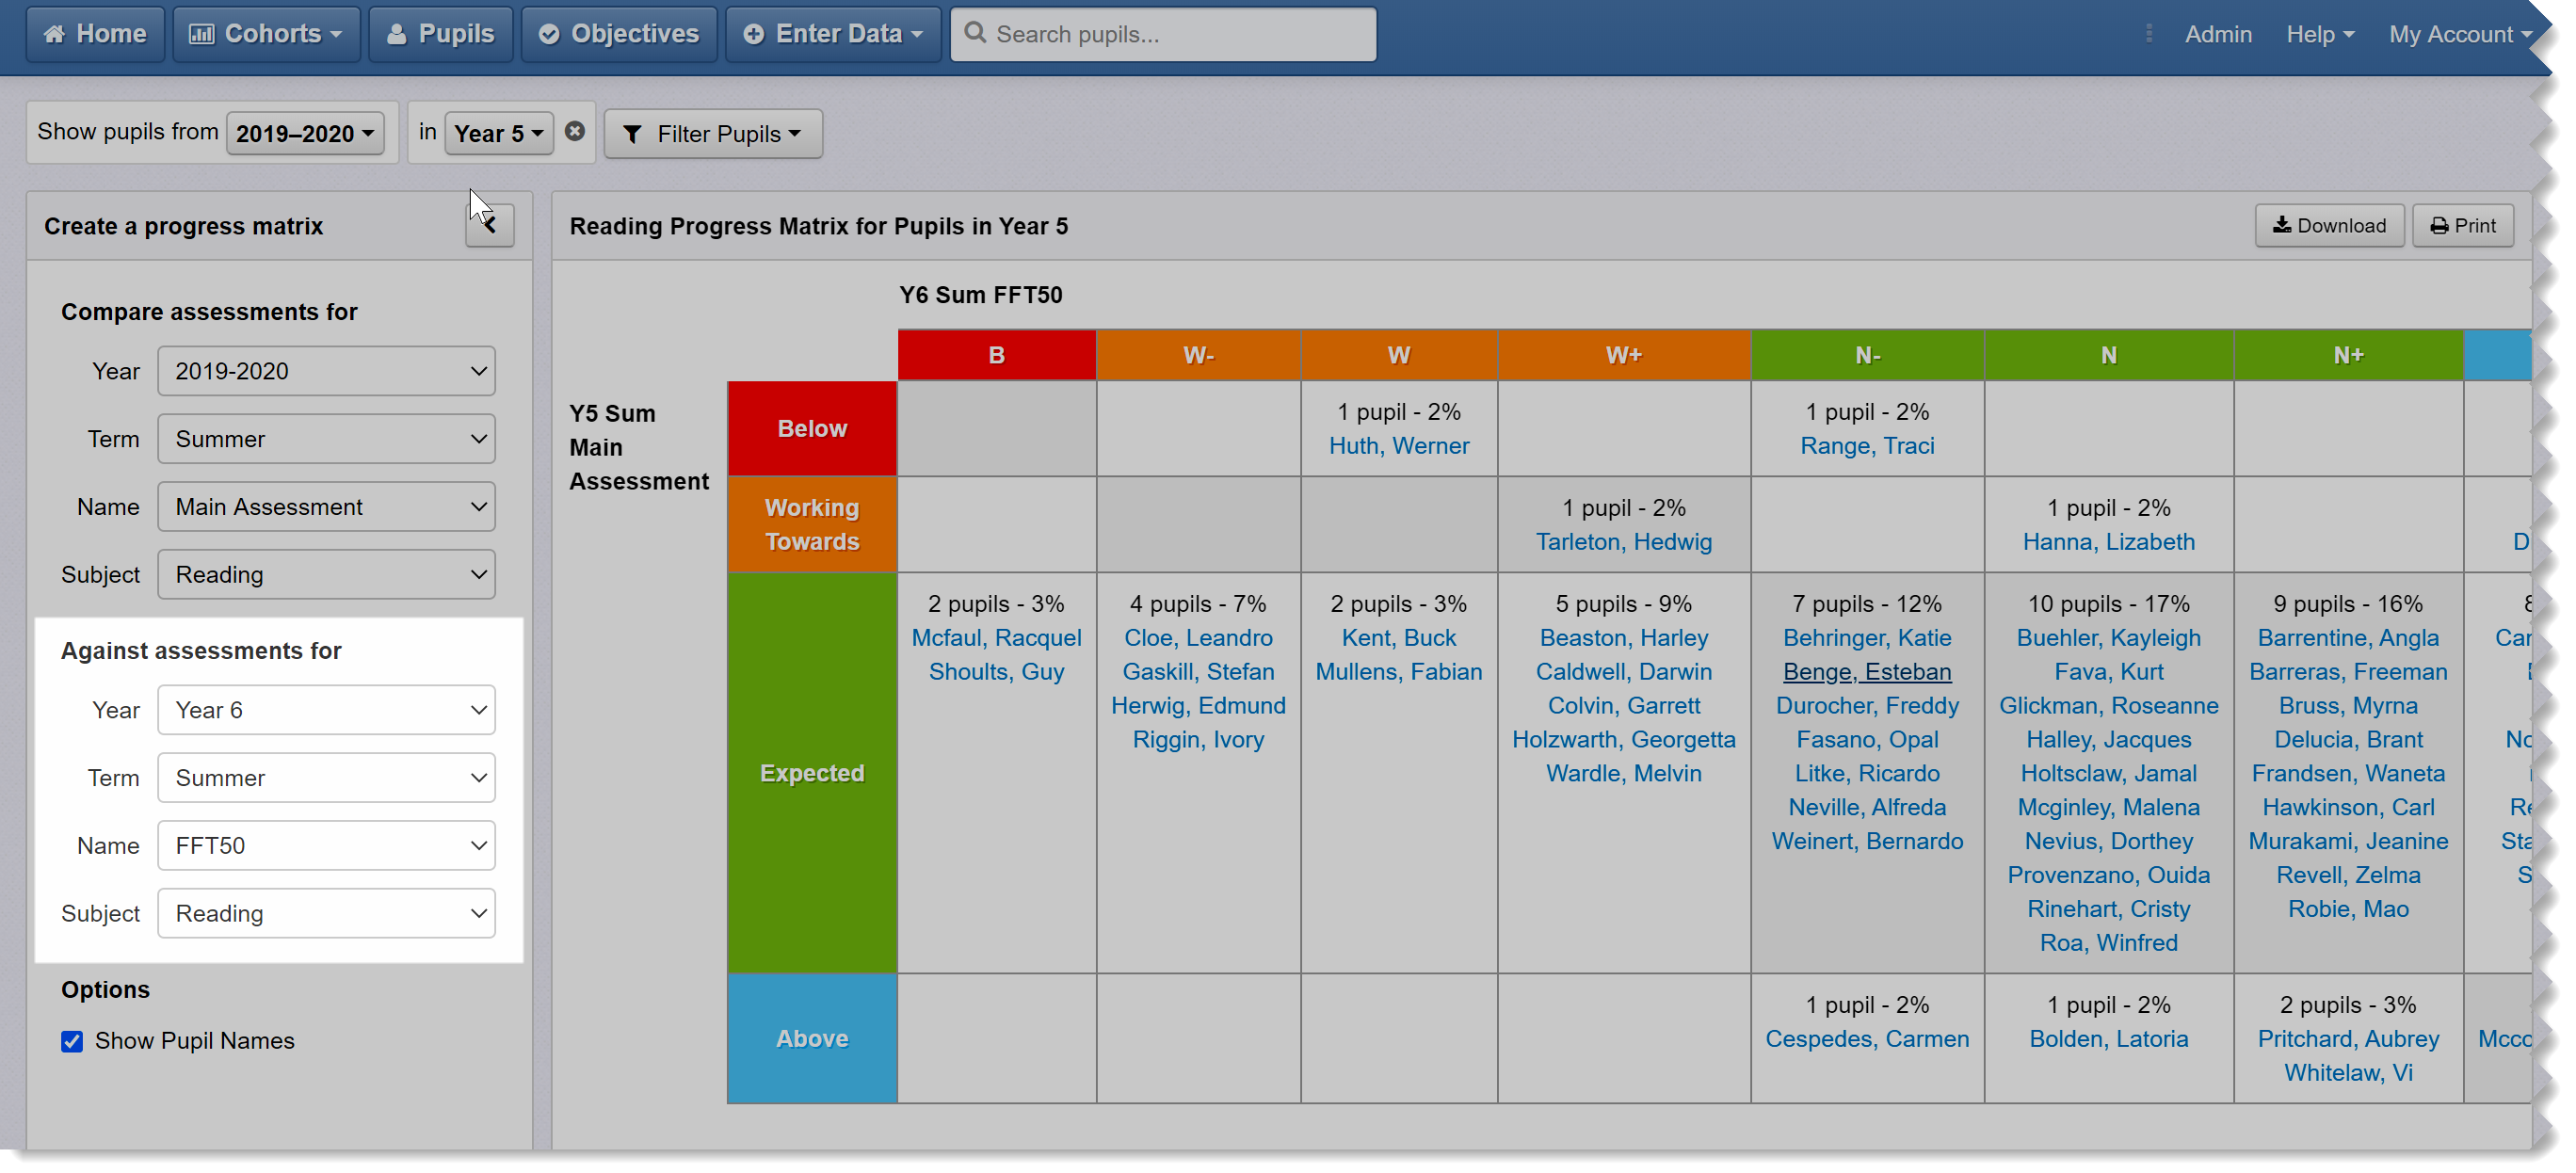
Here, we are comparing Year 5's latest teacher assessments in Reading to FFT50 estimates to see which pupils are and are not on track. We are might be concerned about pupils with an FFT 'N' estimate (N = National Standard) whose teacher assessment is below 'Expected'. In the case above, there are only two such pupils.
And finally…
As with other reports, you can print progress matrices or download them as an image file by clicking on the Print and Download buttons. When printing, use your web browser's 'Print to PDF' or 'Save as PDF' option to generate a PDF. The latter is recommended for emailing and sharing with governors.
Another option is simply to copy and email the URL (the web address) in the address bar. This is a good option for sharing amongst staff who have their own access.
Further support
We hope this has been a useful introduction to the Progress Matrix. If you need help with anything not covered here, just contact our friendly support team.