Attendance report
 Updated
The Attendance report is designed to deliver a cohort overview of aggregated attendance data, offer comparisons, and save time when deciding which individual pupils to focus on. The Pupil Attendance report then affords a detailed review of attendance for individual pupils.
It is available for schools and for Trust users, to get a trust overview and compare schools.
This guide details the content of the report, section by section, and how it might be used.
If you'd like a complete video guide to analysing attendance data, please see our webinar recording from October 2024.
Filtering and Grouping
The cohort attendance report supports the full range of filters and lets you group your data for quick comparisons.
Apply filters to limit the data displayed in the report. Use Group Pupils to compare groups (for example, pupil premium compared with not pupil premium). When grouping, each part of the report will update to allow comparisons.
Trust users are able to filter by school and also group by school, to get direct school comparisons within the report.
Toolbar options
Report Date Range
By default, the report shows the data for the current academic year to date.
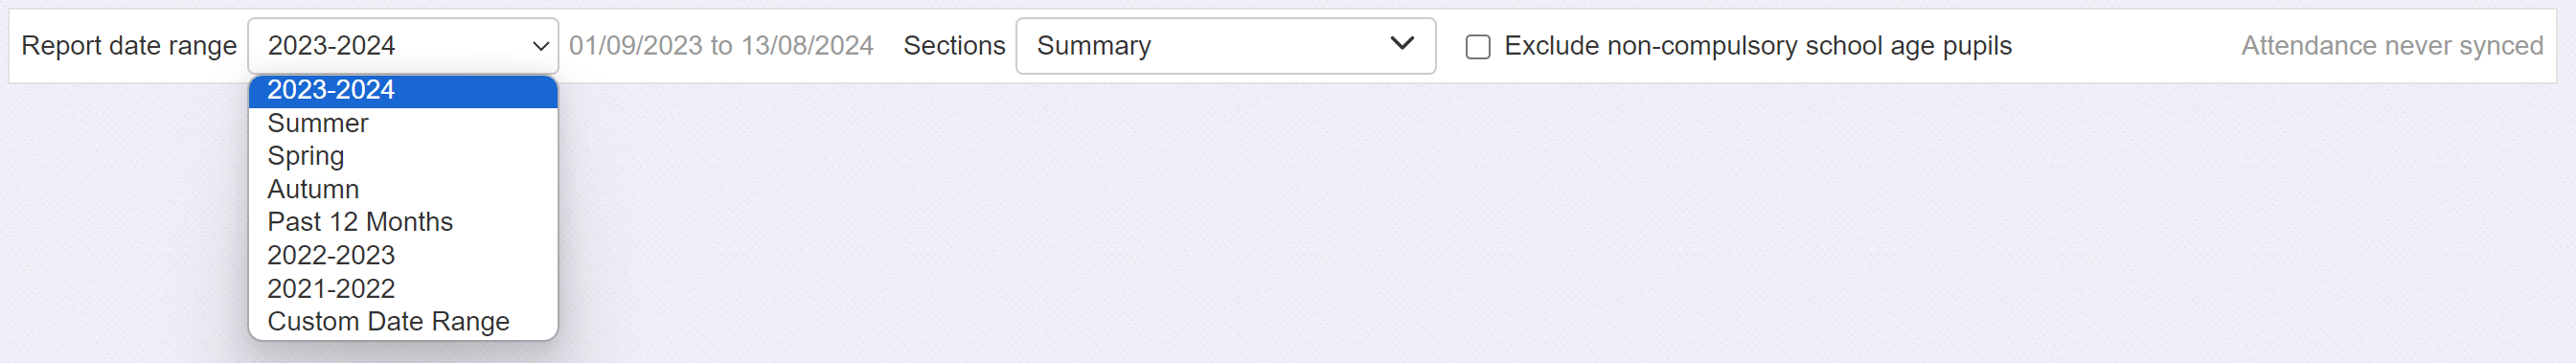
Within the current year, you are also able to select a term to review. Terms use the term dates you have set for your school. The Trust attendance report will use term dates set for the Trust.
You can also choose to look at the data for the Past 12 months. This is particularly useful in the Autumn term, as it will include dates before the Summer holiday, in the previous academic year.
It is also possible to look at data for the previous two, complete, academic years.
If you have a specific time frame you want to analyse, Custom Date Range allows you to select it. Choose Custom Date range, then enter the dates in the two date pickers that become available.
Exclude non-compulsory school age pupils
By default, the report will include all the pupils in your school. If you want to view the data with only pupils of compulsory school age included, use this option.
Ticking the box will exclude any pupils who are not at least 5 years old on the report date range start date.
An exception to this is when you have the Report date range set to a whole academic year. In this instance the data will include all pupils who are aged 5 on, or before, 31st August in the applicable academic year.
This matches the approach taken by the DfE in their public attendance data.
"These key measures are calculated for pupils who are of compulsory school age - ie aged between 5 and 15 as at the start of the academic year (31 August)."
Sync date
On the right of the toolbar, slightly greyed out, is a note letting you know how long ago the attendance data was synced with your MIS. Other than the pause during the summer holidays, this should happen overnight, every day. If your data has not been synced for several days, it may be worth checking your MIS sync settings.
Sections
The cohort report is split into 6 different sections, each with a different focus.
By default, all the sections are enabled. Use the menu to toggle each one on or off. This can be useful if you're grouping the data by multiple groups, as each section can get quite large, or if you want to tune the report to suit the intended audience, governors may be interested in high level breakdowns but not daily analysis for example.
Summary
The summary section gives you a breakdown of pertinent attendance data with a focus on being actionable. It includes percentages and also, in keeping with DfE advice, focusses on school days missed due to absence.
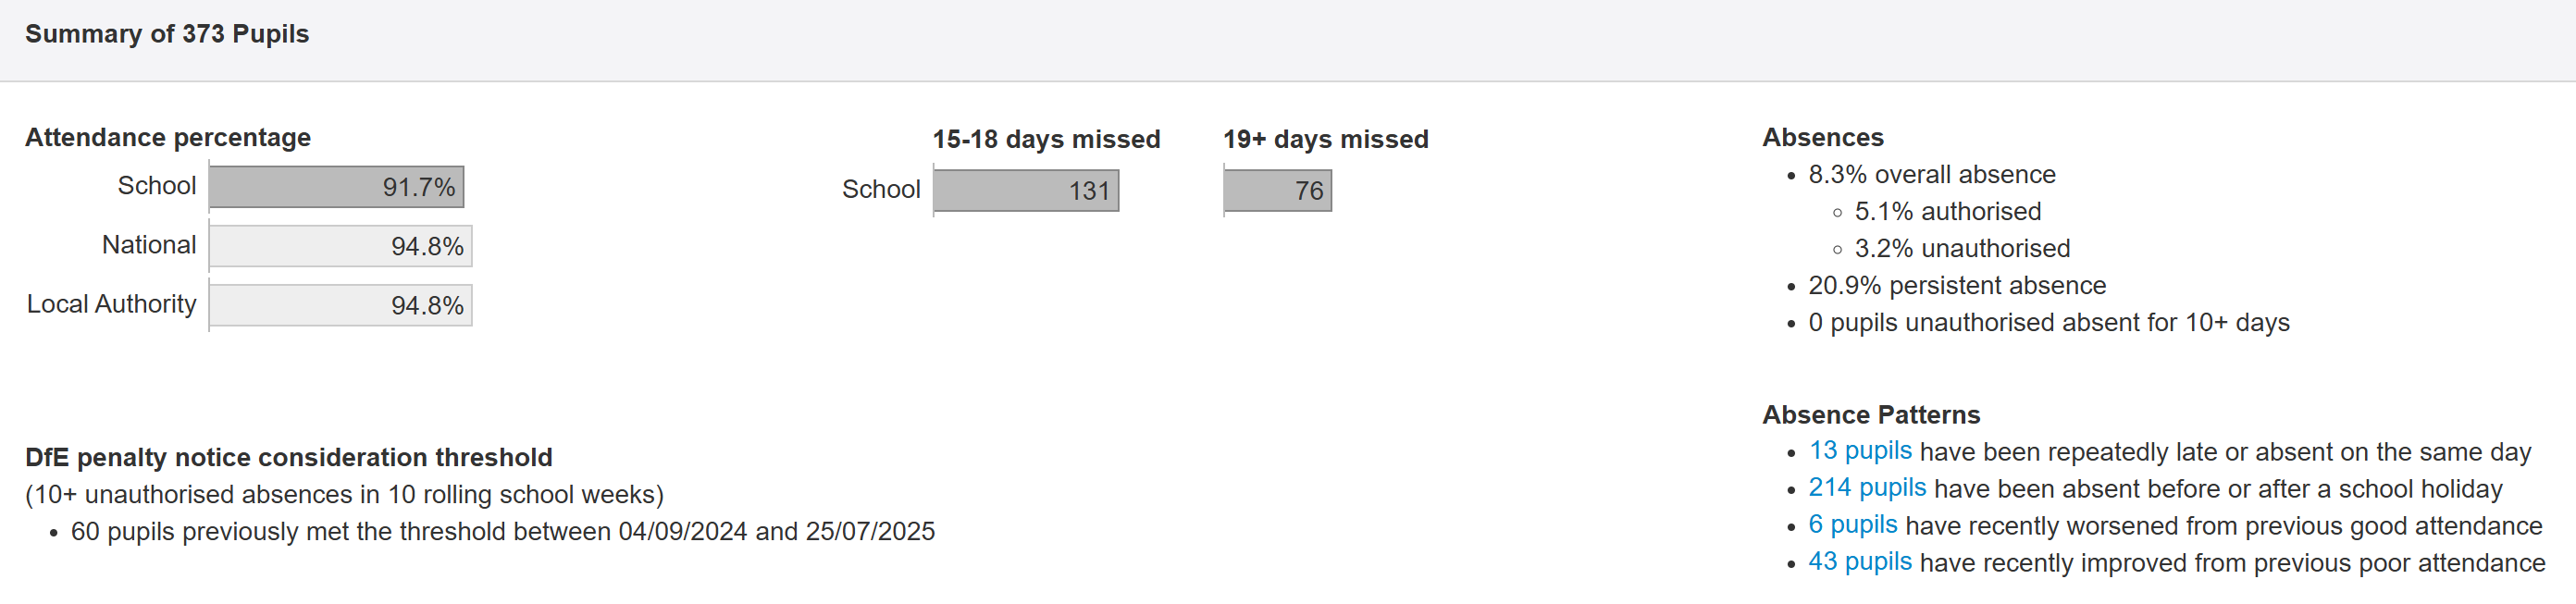
To give you the context the header gives the total number of pupils represented in the report.
Attendance percentage
The bars will update based on your time period selection.
- School - Shows the total attendance percentage for the school (or Trust if viewing the Trust report) or any applied filter, for the selected date range. If you hover the mouse over the School bar you'll get some information about a previous period for comparison. This will change, depending on your date range selection, to ensure it's an appropriate comparison, as follows:
- Current Academic Year - Displays previous academic year to the same date. Useful to compare the current point in the academic year with the exact same point last year.
- Last academic year - Displays the value for the previous academic year (If 2 years ago is selected nothing is displayed on hover over as Insight only has attendance data for three years).
- Terms will display the final value for the previous term, unless Autumn is selected then nothing is displayed.
- Past 12 months - Display the previous 12 months, over the same date range.
- Custom date range - Displays the same number of days prior to the selection (if Insight has the data, otherwise nothing will be displayed)
- National - Shows the national total attendance percentage for the selected date range.
- For Primary schools, the national value is for English state-funded Primary schools.
- For Secondary schools, the national value is for English state-funded Secondary schools.
- If you're viewing the Trust version of the attendance report, and have a mix of Primary and Secondary schools, the report will show both national values, and label them accordingly. If you only have Primary or Secondary schools the label will just say National (with Primary or Secondary displayed as a tooltip).
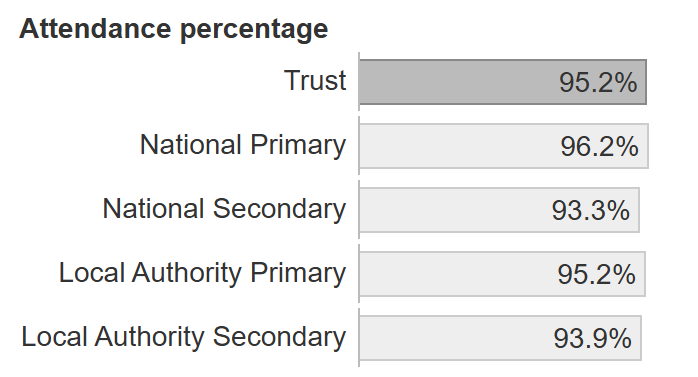
- Local Authority - Shows the total attendance percentage for English state funded Primary schools and/or Secondary schools (as above) in your Local Authority, for the selected date range. Hover over the Local Authority label to check the Local Authority is the correct one. If your school is not part of a Local Authority, this bar will not display.
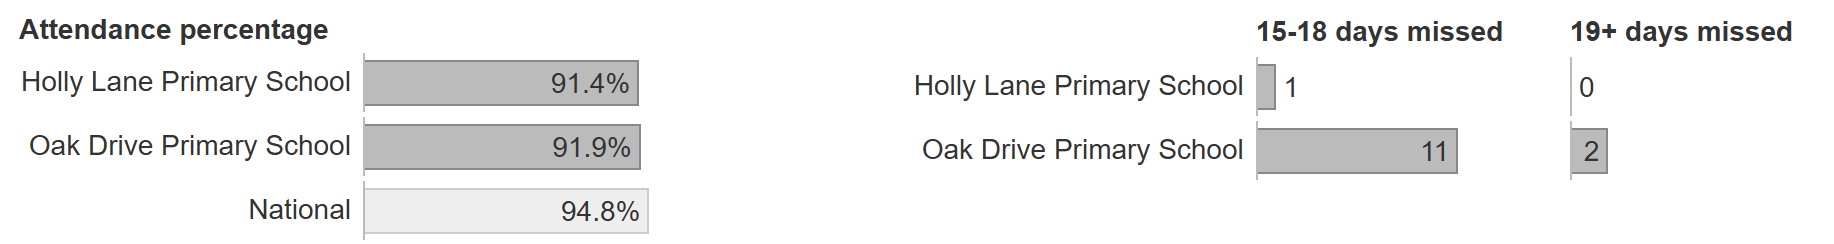
Days missed
Two bars are shown here displaying the following:
- Missed 15-18 days - Shows the number of pupils who have missed 15 to 18 days in the defined period. This could be used as an early warning indicator that a pupil is moving towards being a persistent absentee.
- Missed 19+ days - Shows the number of pupils who have missed 19 days or more in the defined period. When a pupil reaches 19 days missed in an academic year that pupil will now be a persistent absentee, for the year, regardless of attendance from that point onwards.
Clicking on either bar will display the names of all the pupils references, sorted by their total days missed.
Absences
This section provides absence percentage breakdown, for the filtered pupils and report date range, as follows.
- Percentage of overall absence. This includes any absence type.
- Percentage of authorised absences.
- Percentage of unauthorised absences.
Click to see the latest national value, for comparison, and the breakdown of which codes were used for each absence.
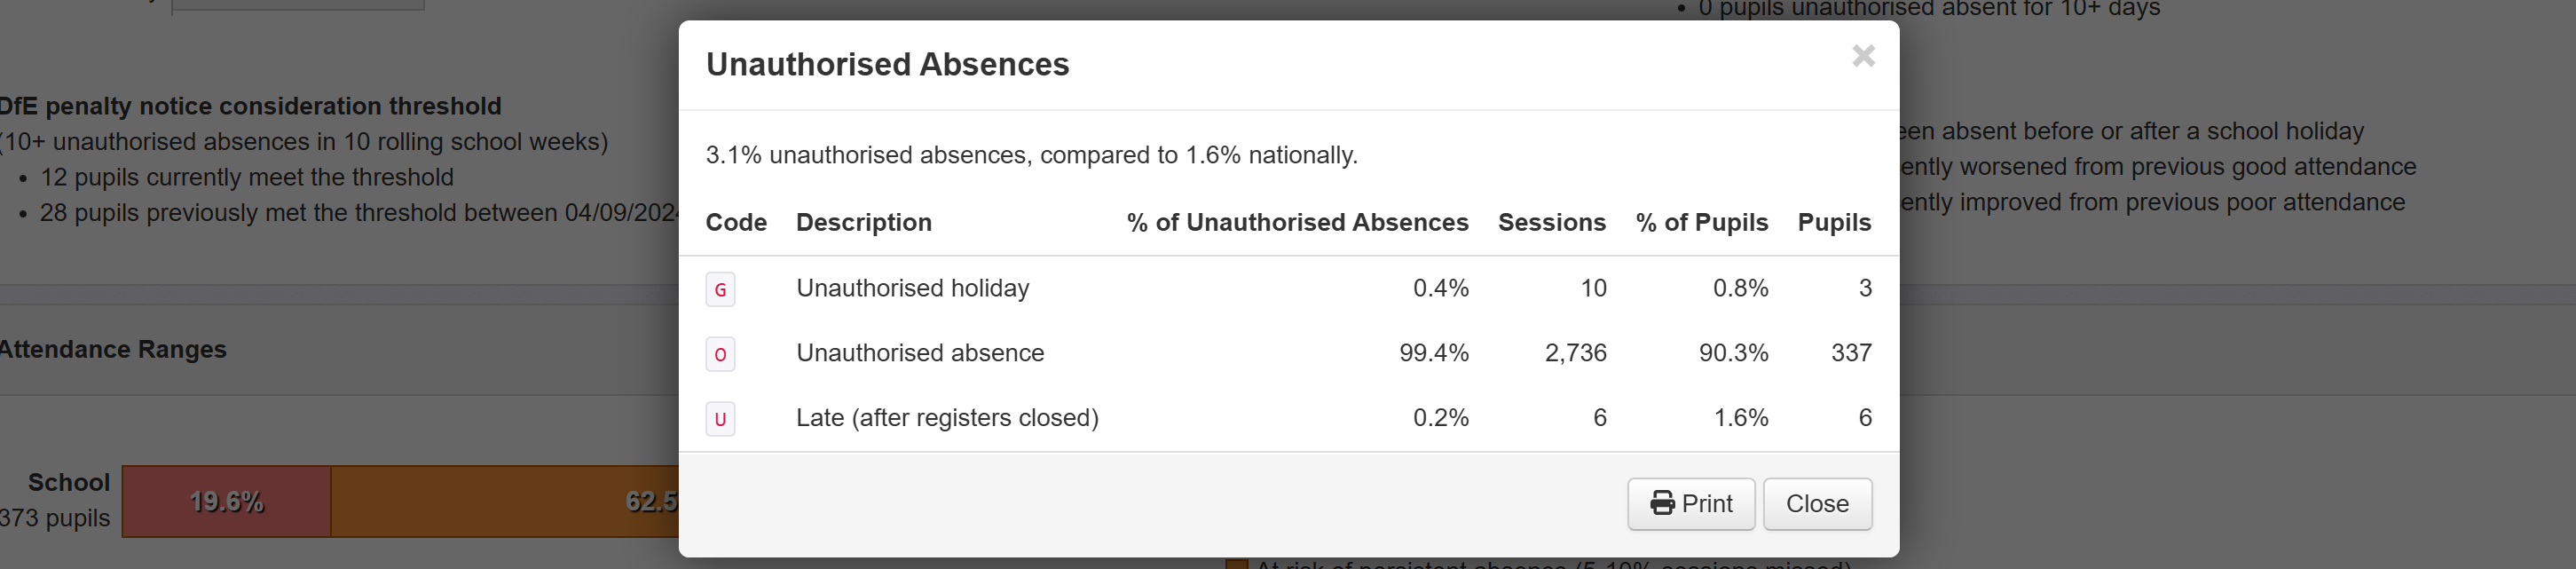
For each code you can see the percentage proportion and number of sessions with that code.
You can also see the percentage and number of pupils with any instance of each code in the selected report date range. This can be useful if, for example, you want to know how many pupils have had an unauthorised holiday during the academic year.
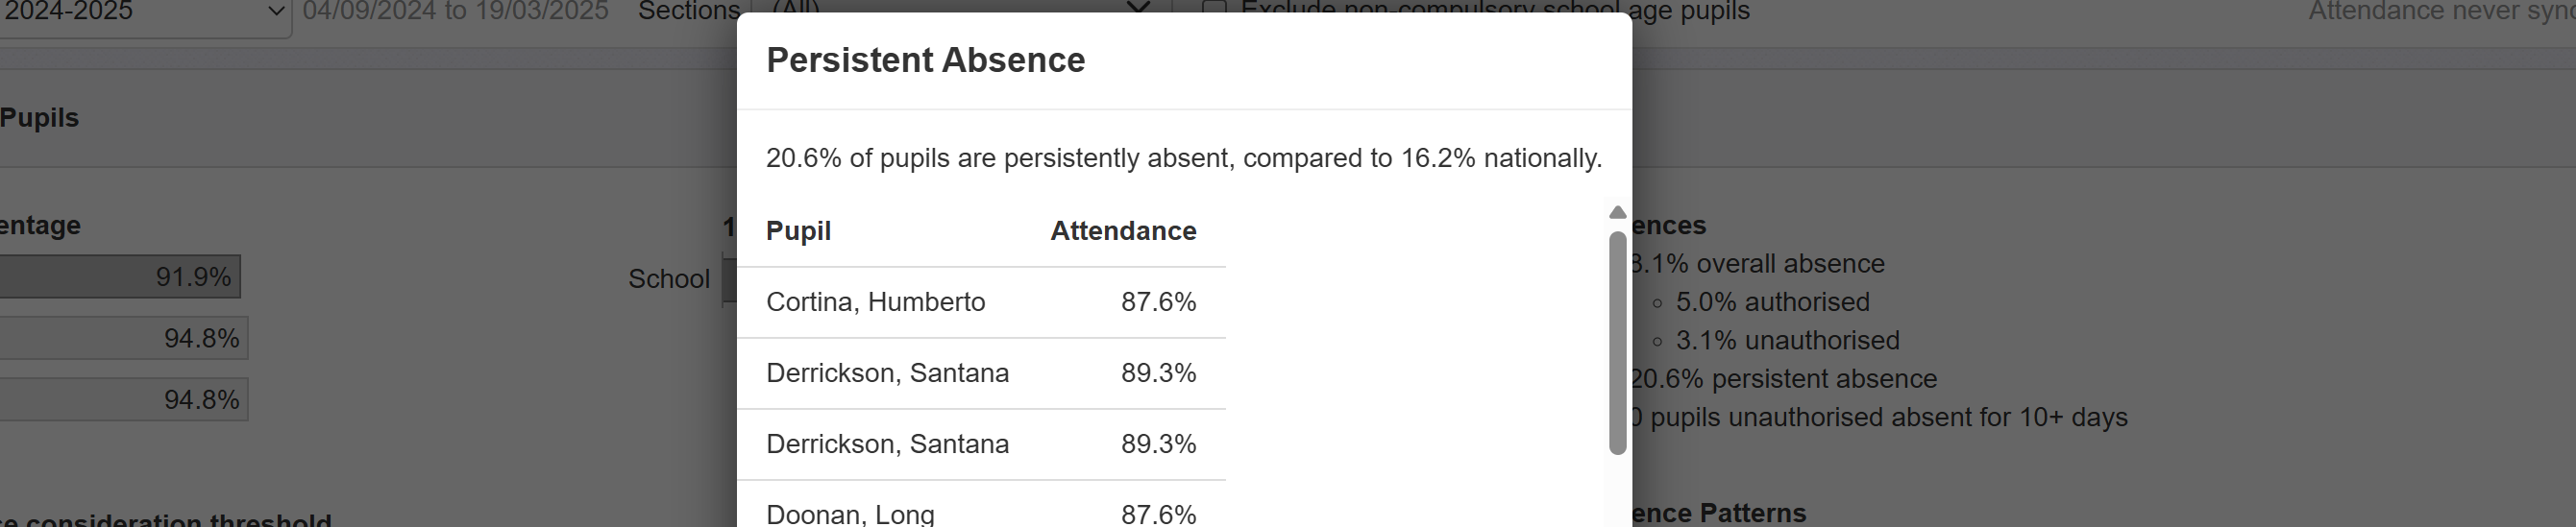
- Persistent absence. Click to see the latest national value and the names of any pupils with persistent absence, and their actual attendance percentage.
If your report date range end date is within the current academic year, the national values, displayed in the click through views for authorised, unauthorised and persistent absence are always the latest available ones from the DfE.
If your report date range end date is within a previous academic year, the national values, displayed in the click through views for authorised, unauthorised and persistent absence will be the full academic year value, for the applicable academic year, where available.
- 10+ continuous days absence. If any pupils have had a period of 10 continuous days unauthorised absence, in the selected date range, it will be indicated here. A requirement for some local authority attendance returns, this is described on page 21 of the DfE Working together to improve school attendance document. The considered time period is the selected date range only. For example, with the current academic year selected, a pupil with 5 continuous days absence last academic year will not meet the threshold if they have a further 5 continuous days absence at the start of the current academic year. As per the DfE specification, the first unauthorised session we include in the data can be an afternoon session, if it starts a period of 20 continuous sessions of unauthorised absence.
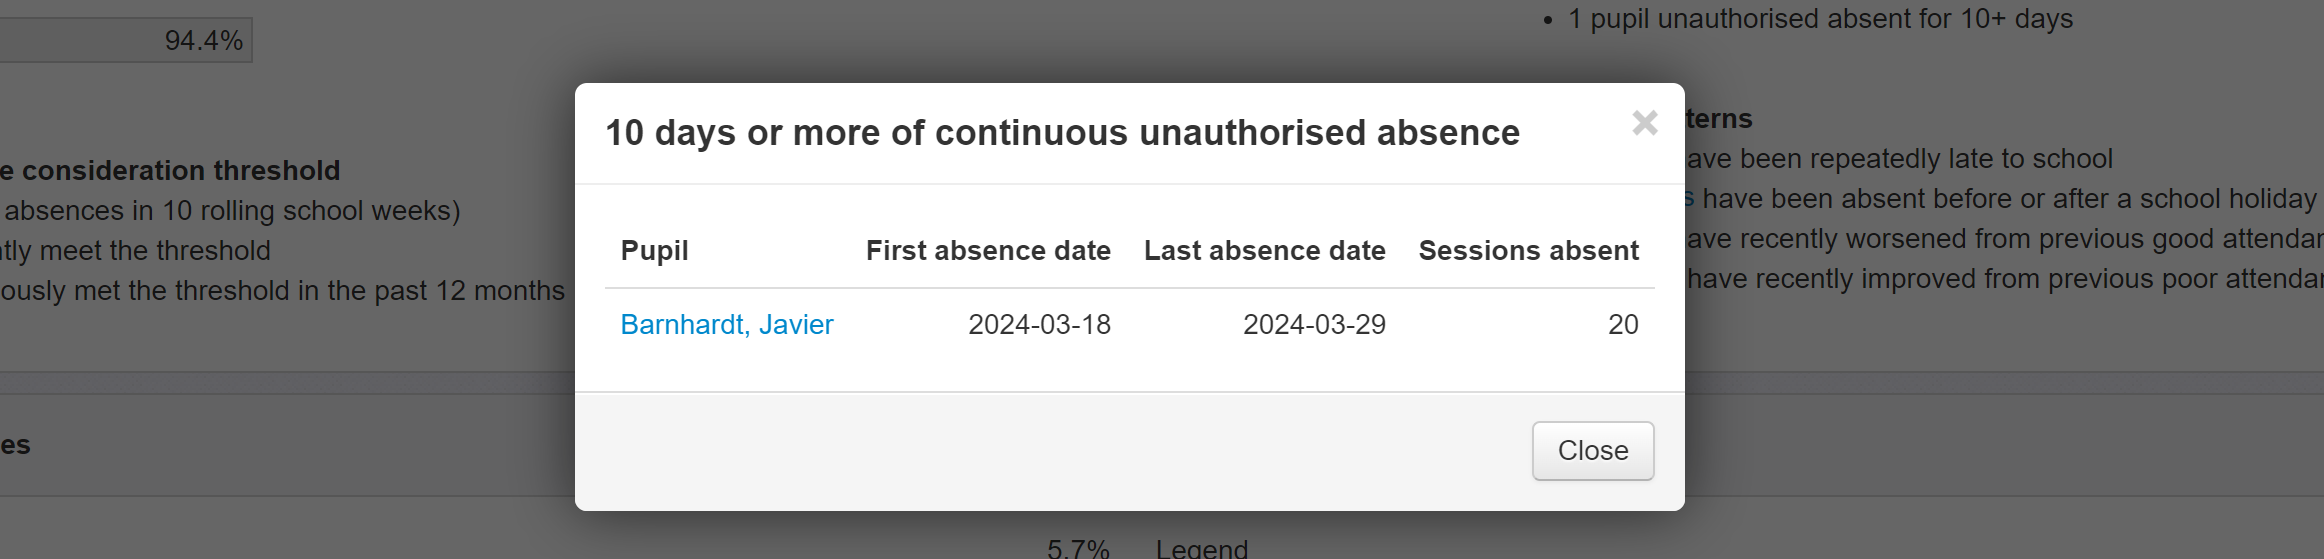
Click to see the pupils concerned and details of the first and last absence dates, and the total sessions absent. The last absence date will be blank if the latest data indicates that a pupil has yet to return to school. If a pupil has had multiple periods of 10+ continuous days absence, in the selected date range, they will all be shown here.
Absence Patterns
These are designed to identify trends in pupil attendance that may be worth further investigation. The number of pupils meeting the following defined patterns will be shown:
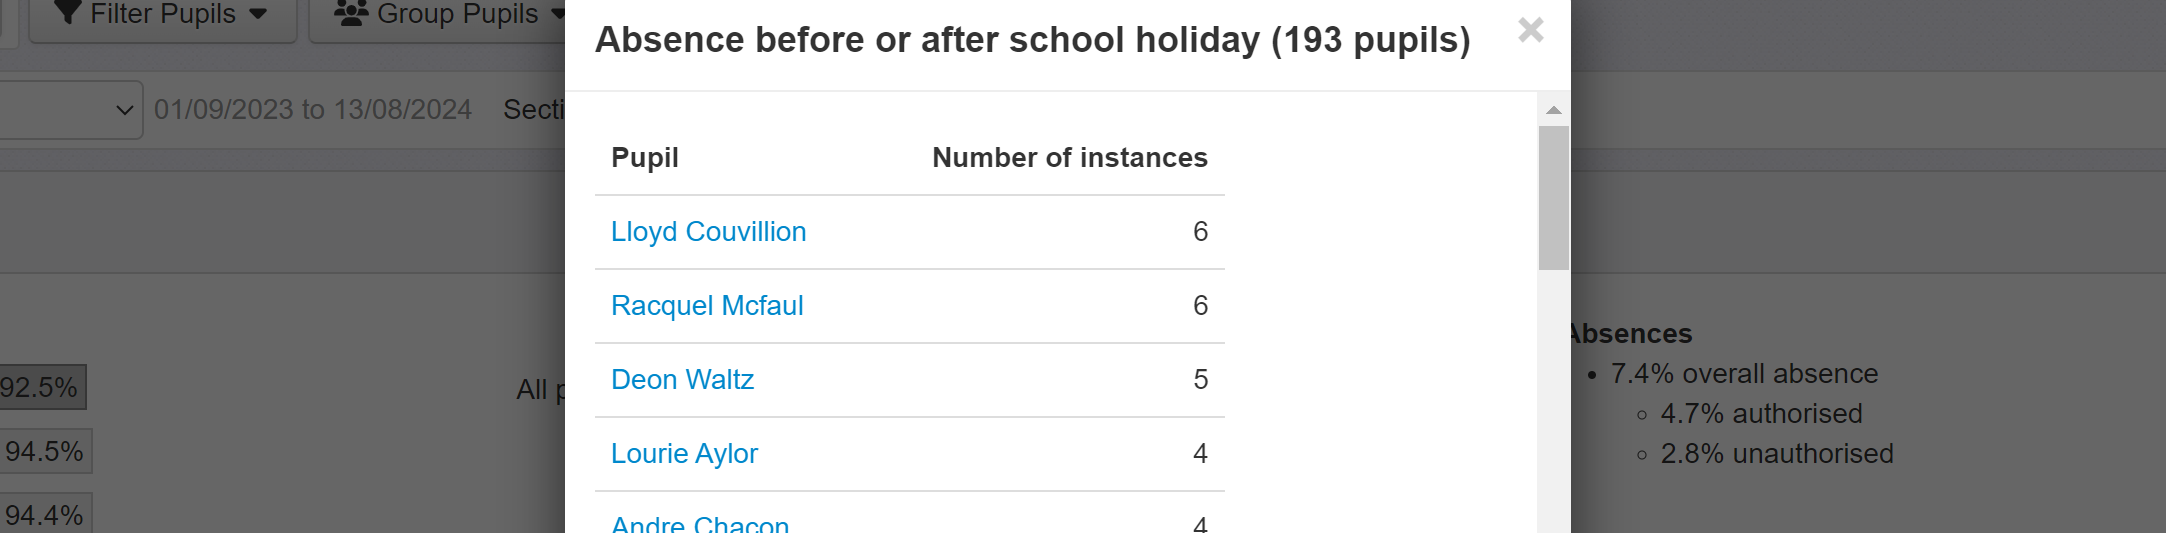
- Absence before or after a school holiday - A pupil meets this pattern if they have one or more sessions absent immediately before or after a school holiday.
- Repeatedly late or absent on the same day - A pupil meets this pattern if they're late (L or U code) to school or absent (authorised or unauthorised) on the same day of the week at least 5 times, and for more than 30% of the total number of that day in the selected period. E.g. L or U on 5 of 10 Wednesdays in the defined period would meet the threshold.
- Recently worsened from previous good attendance - This is designed as a possible early intervention indicator. It identifies pupils with good attendance historically but recent absences that may be indicative of a change in behaviour. A pupil meets this pattern if:
- Total range of the selected period must be greater than 8 weeks, excluding school closure, and have an end date within the current academic year.
- Pupil(s) must have missed 6 or more sessions in the last 4 weeks of the selected period.
- Overall attendance % for rest of selected period must be greater than 95%.
- Overall attendance % for current academic year must not be more than 97%.
- Recently improved from previous poor attendance - This is designed to highlight pupils with improving attendance in order that this change in behaviour may be recognised and encouraged. A pupil meets this pattern if:
- Total range of the selected period must be greater than 8 weeks, excluding school closure, and have an end date within the current academic year.
- They missed no more than 2 sessions (one day) in the last 4 weeks
- Meaning that overall attendance % for the last 4 weeks of the selected period will usually be above 90%. This may not be the case if pupils do not attend for full days, such as nursery pupils who may only attend for half-days, as 2 sessions may then equate to more than 10% of the total.
- 4 weeks is defined as the current week plus the previous 3 weeks (excluding school holidays) running to the Monday of that week. For example, if today is the 4th June 2026, the first included date will be the 4th May.
- Overall attendance % for the rest of the selected period must be below 90%.
Click the number to see pupils meeting the pattern listed. Click a name to view their individual attendance page.
DfE "10 in 10" penalty notice consideration threshold
The DfE define the following national threshold, which applies to all pupils of compulsory school age.
All state funded schools must consider whether a penalty notice for absence is appropriate in each individual case where one of their pupils reaches the national threshold for considering a penalty notice. Schools should not have a blanket position of issuing or not issuing penalty notices and should make judgements on each individual case to ensure fairness and consistency across the country. The threshold is 10 sessions of unauthorised absence in a rolling period of 10 school weeks. A school week means any week in which there is at least one school session. This can be met with any combination of unauthorised absence (e.g. 4 sessions of holiday taken in term time plus 6 sessions of arriving late after the register closes all within 10 school weeks). These sessions can be consecutive (e.g. 10 sessions of holiday in one week) or not (e.g. 6 sessions of unauthorised absence taken in 1 week and 1 per week for the next 4 weeks). The period of 10 school weeks can also span different terms or school years (e.g. 2 sessions of unauthorised absence in the Summer Term and a further 8 within the Autumn Term).
From Working together to improve school attendance, section 181
A week is considered ‘active’ on the first day in which there is a school session, so considered within the threshold calculation.
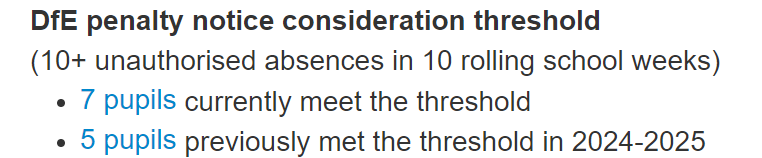
If your selected date range ends with today's date, this section will indicate if any pupils currently meet the 10 in 10 threshold.
As a pupil could meet the threshold on, for example, Friday, but no longer meet the threshold on the following Monday, it will also be indicated if any pupils met the threshold at any point during the selected date range.
Clicking the link will list all the relevant pupils. Clicking a pupil name will open the individual attendance report for that pupil.
Attendance Ranges
This section displays the percentage, and number, of pupils in each attendance band. This is based on the Attendance Thresholds you have set for your school (or Trust).
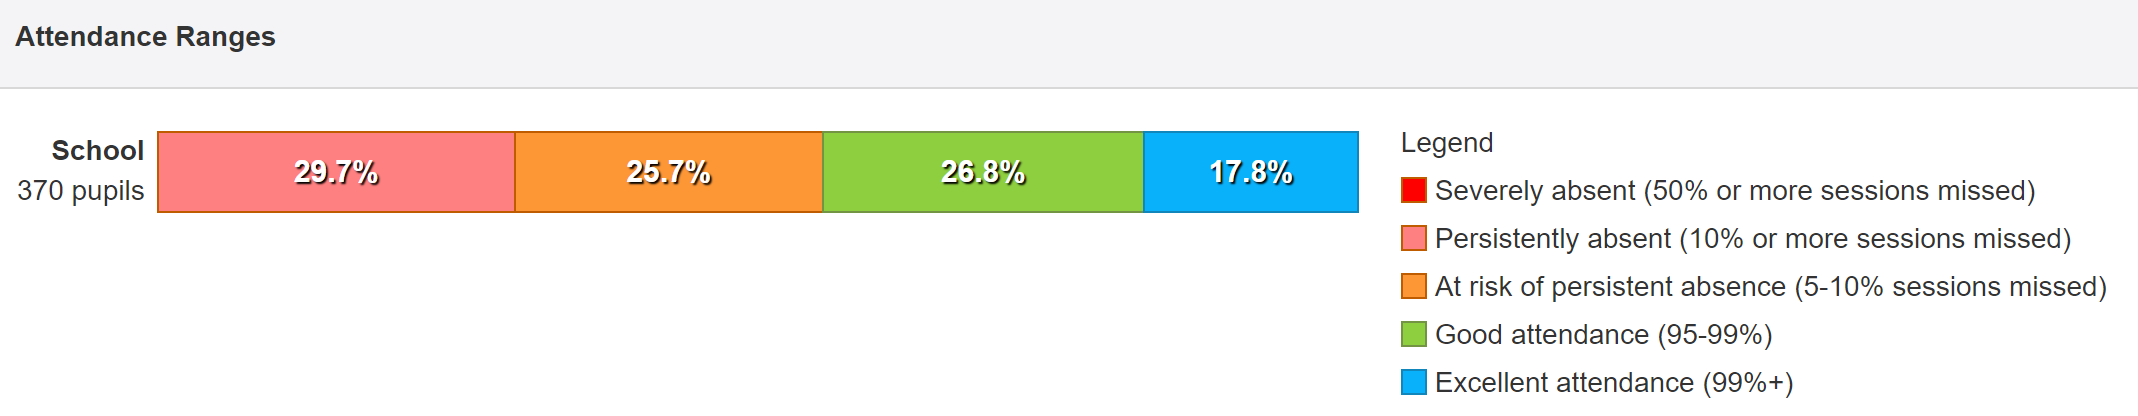
If you have any pupils that are missing data, for the entirety of the selected date range, these will be indicated beneath the bar. Clicking the link will show which pupils are missing data.
Clicking in any band will display the pupil number, and names. Clicking a name will open the attendance tab for that pupil.
Cumulative Attendance Percentage By Week
The chart shows the overall cumulative attendance percentage for each school week.
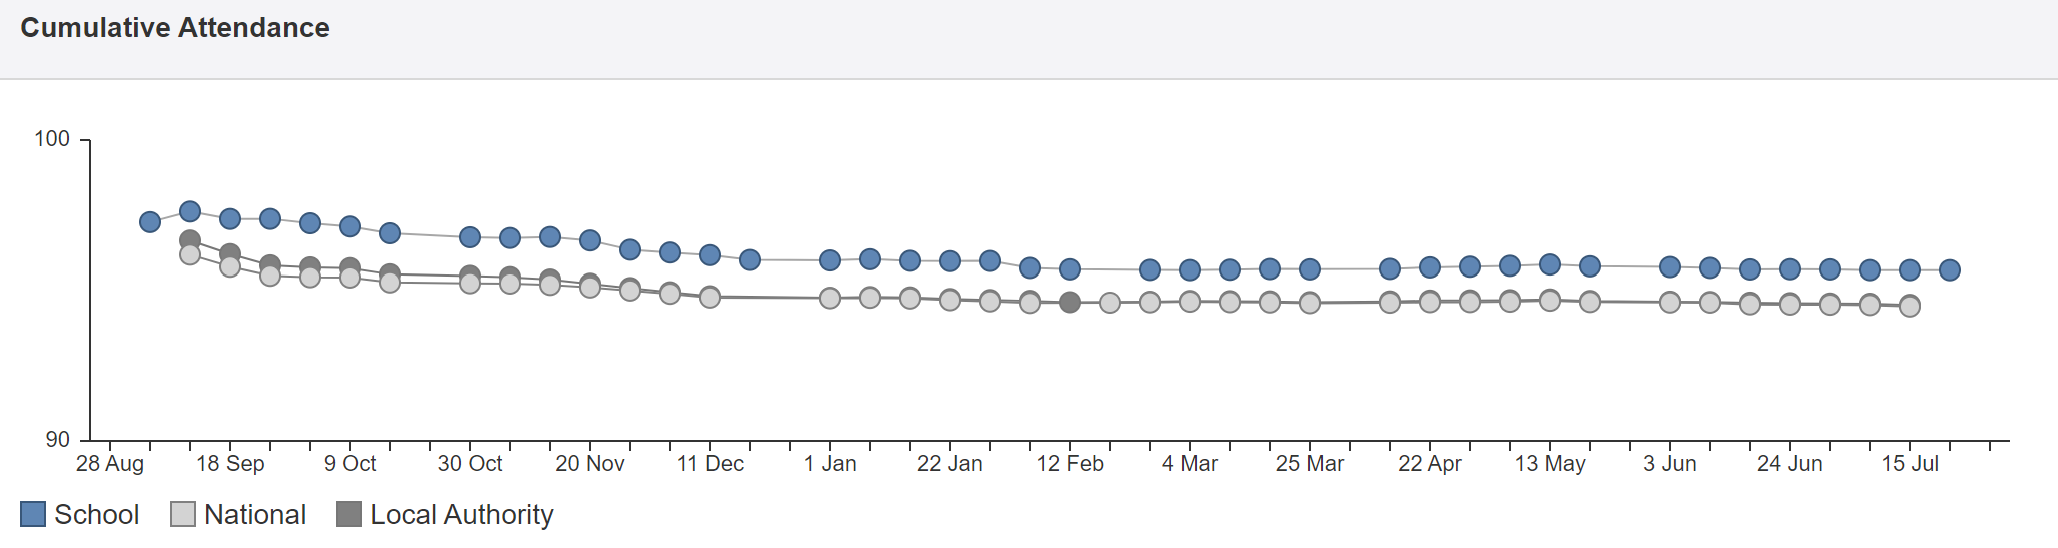
Hovering the mouse over any of the plot points shows the date range (Monday to Friday) and the actual cumulative attendance at that point in time.
Clicking on an item in the key will toggle that series on or off.
The chart is designed to visually demonstrate the ongoing impact of a single week in which a large number of pupils are absent. For example, a large spike in absence in the Autumn term will still be reflected in the overall attendance percentage at the end of the school year.
Weekly absences
This chart shows the overall absence percentage for each week in isolation. It is designed to visually identify any weeks with anomalous attendance patterns that may be worth further investigation. To aid analysis, the comparison with your Local Authority and the National data is also plotted where available.
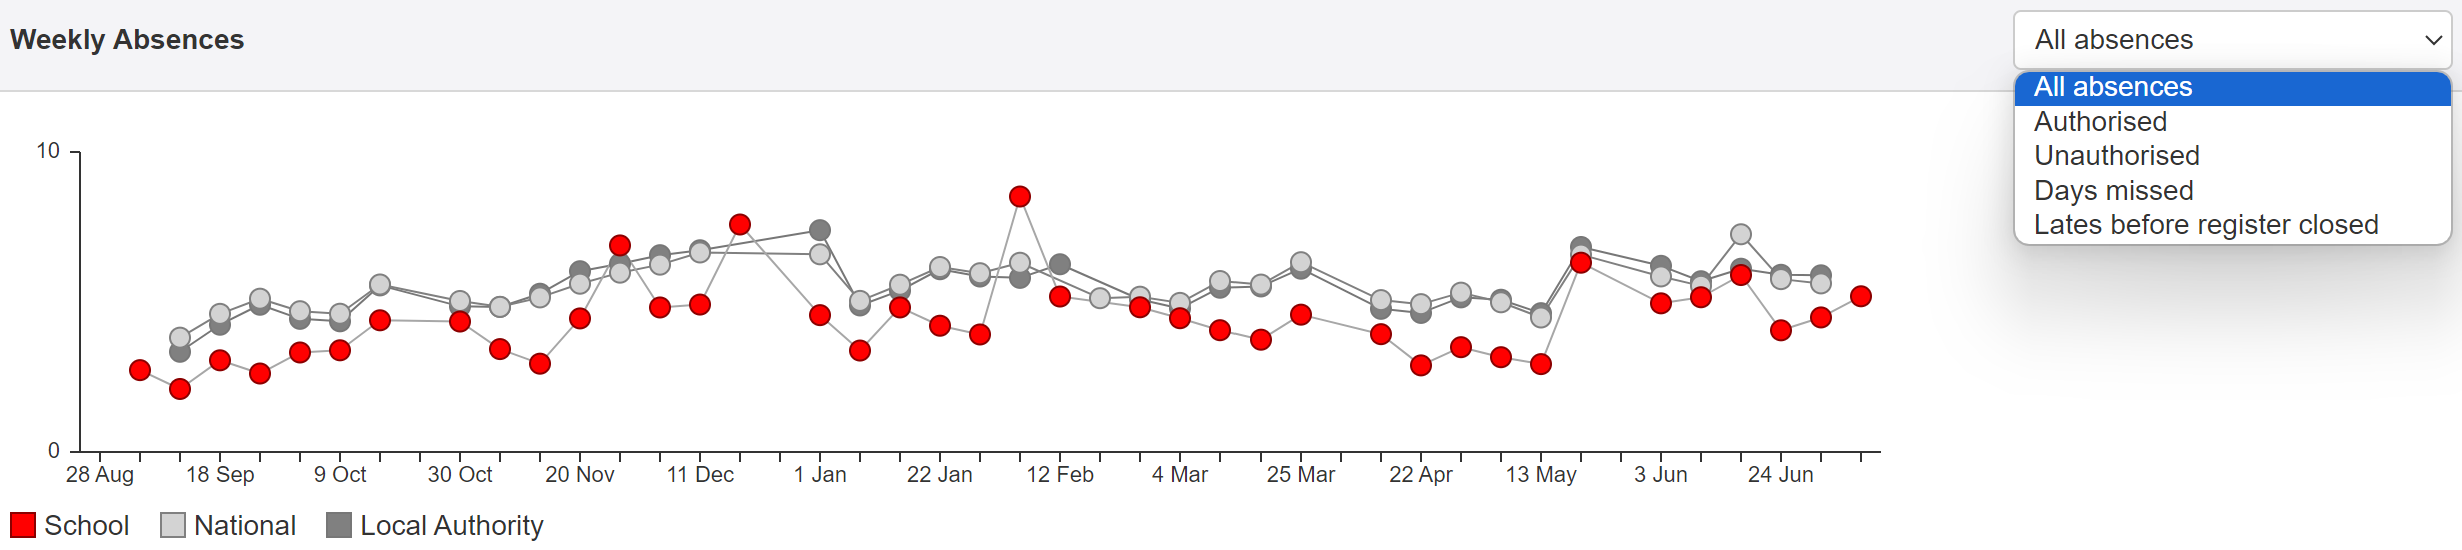
Hovering the mouse over any of the plot points shows the date range (Monday to Friday) and the actual percentage value at that point in time.
The menu also allows you to specify the type of absence you want to see.
Attendance overview
The calendar shows each school day and functions as a heatmap, with darker shades representing higher values for the selected absence type.
Hovering the mouse over a particular day gives the date and the actual value for that day.
Holiday weeks are compressed into single dotted lines for ease of reading.
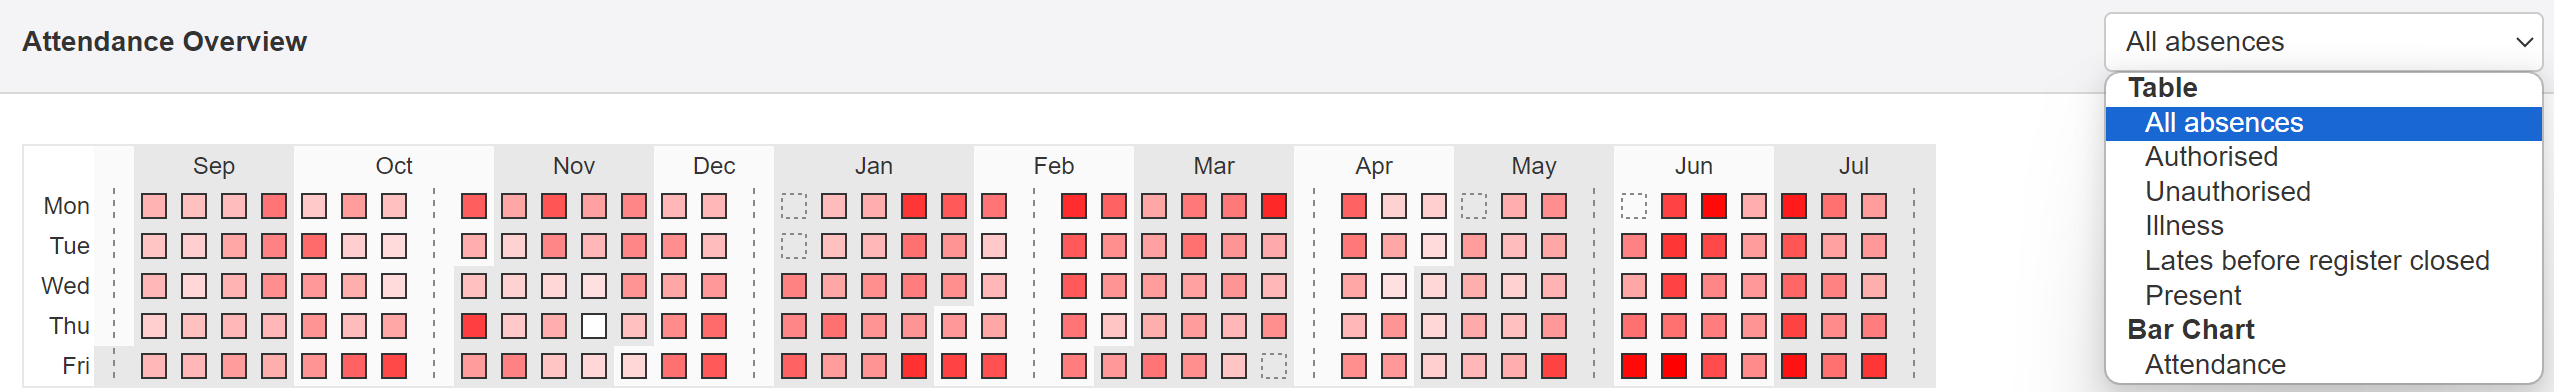
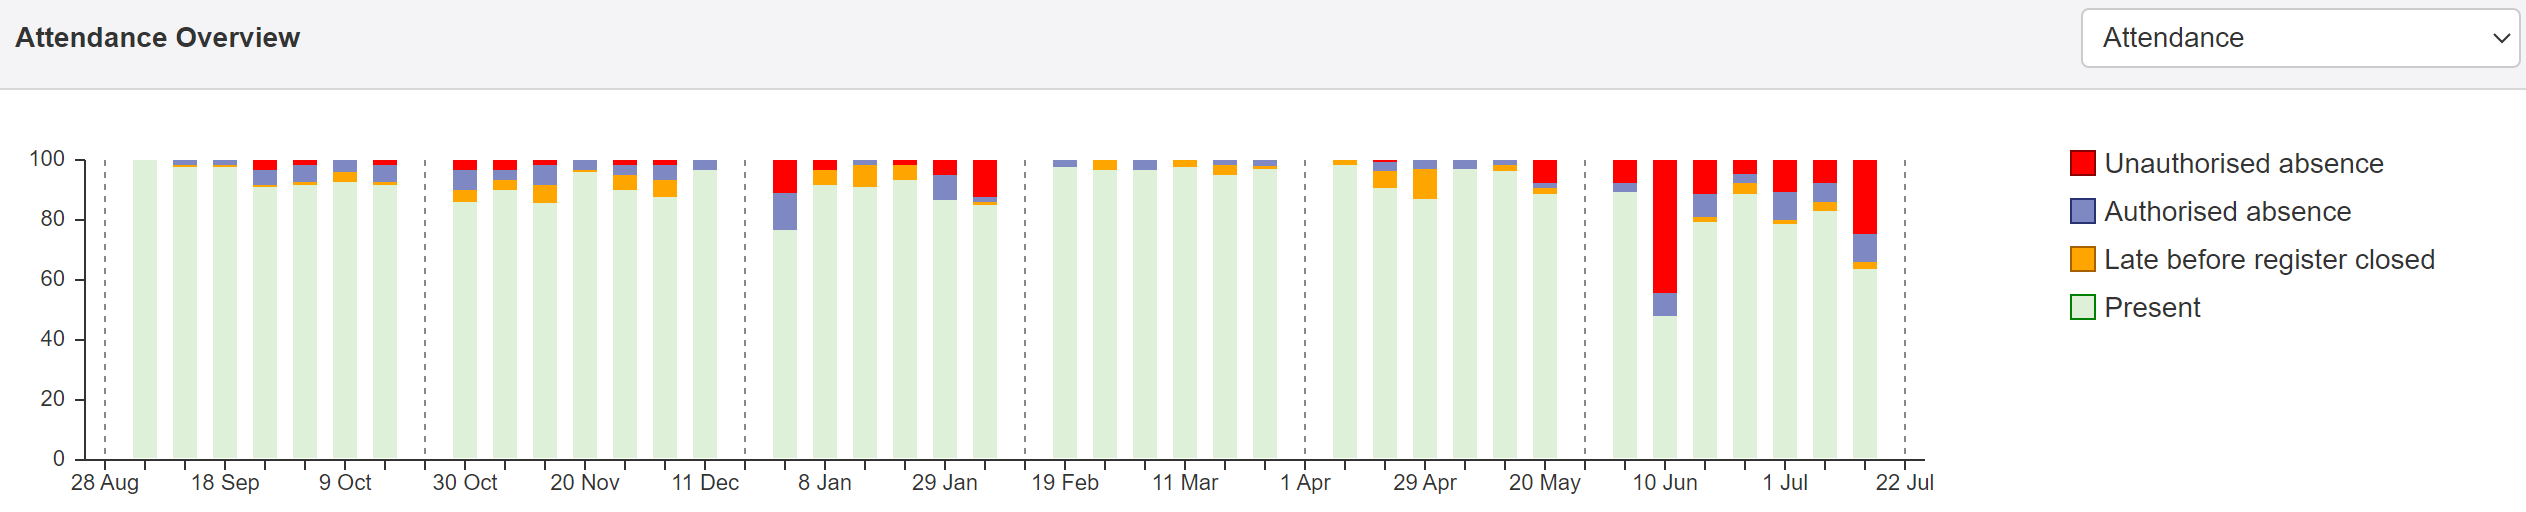
The Table options all show a single absence type, for each day. For ease of understanding, it can be useful to display the absence types together. Choosing the Attendance Bar Chart option will do this, for each week.
This view is most useful when displaying a filtered group, as overall values will usually be highly weighted with Present. It is possible to click on items in the key, however, to toggle them on and off. This will give greater visual prominence to absence values if, for example, you toggle Present off.
Pupils
This provides a versatile, table view of a range of attendance values.
For authorised and unauthorised absences, the number of sessions is also shown in brackets.
When Grouping is applied, it will show a separate row for each of the groups.
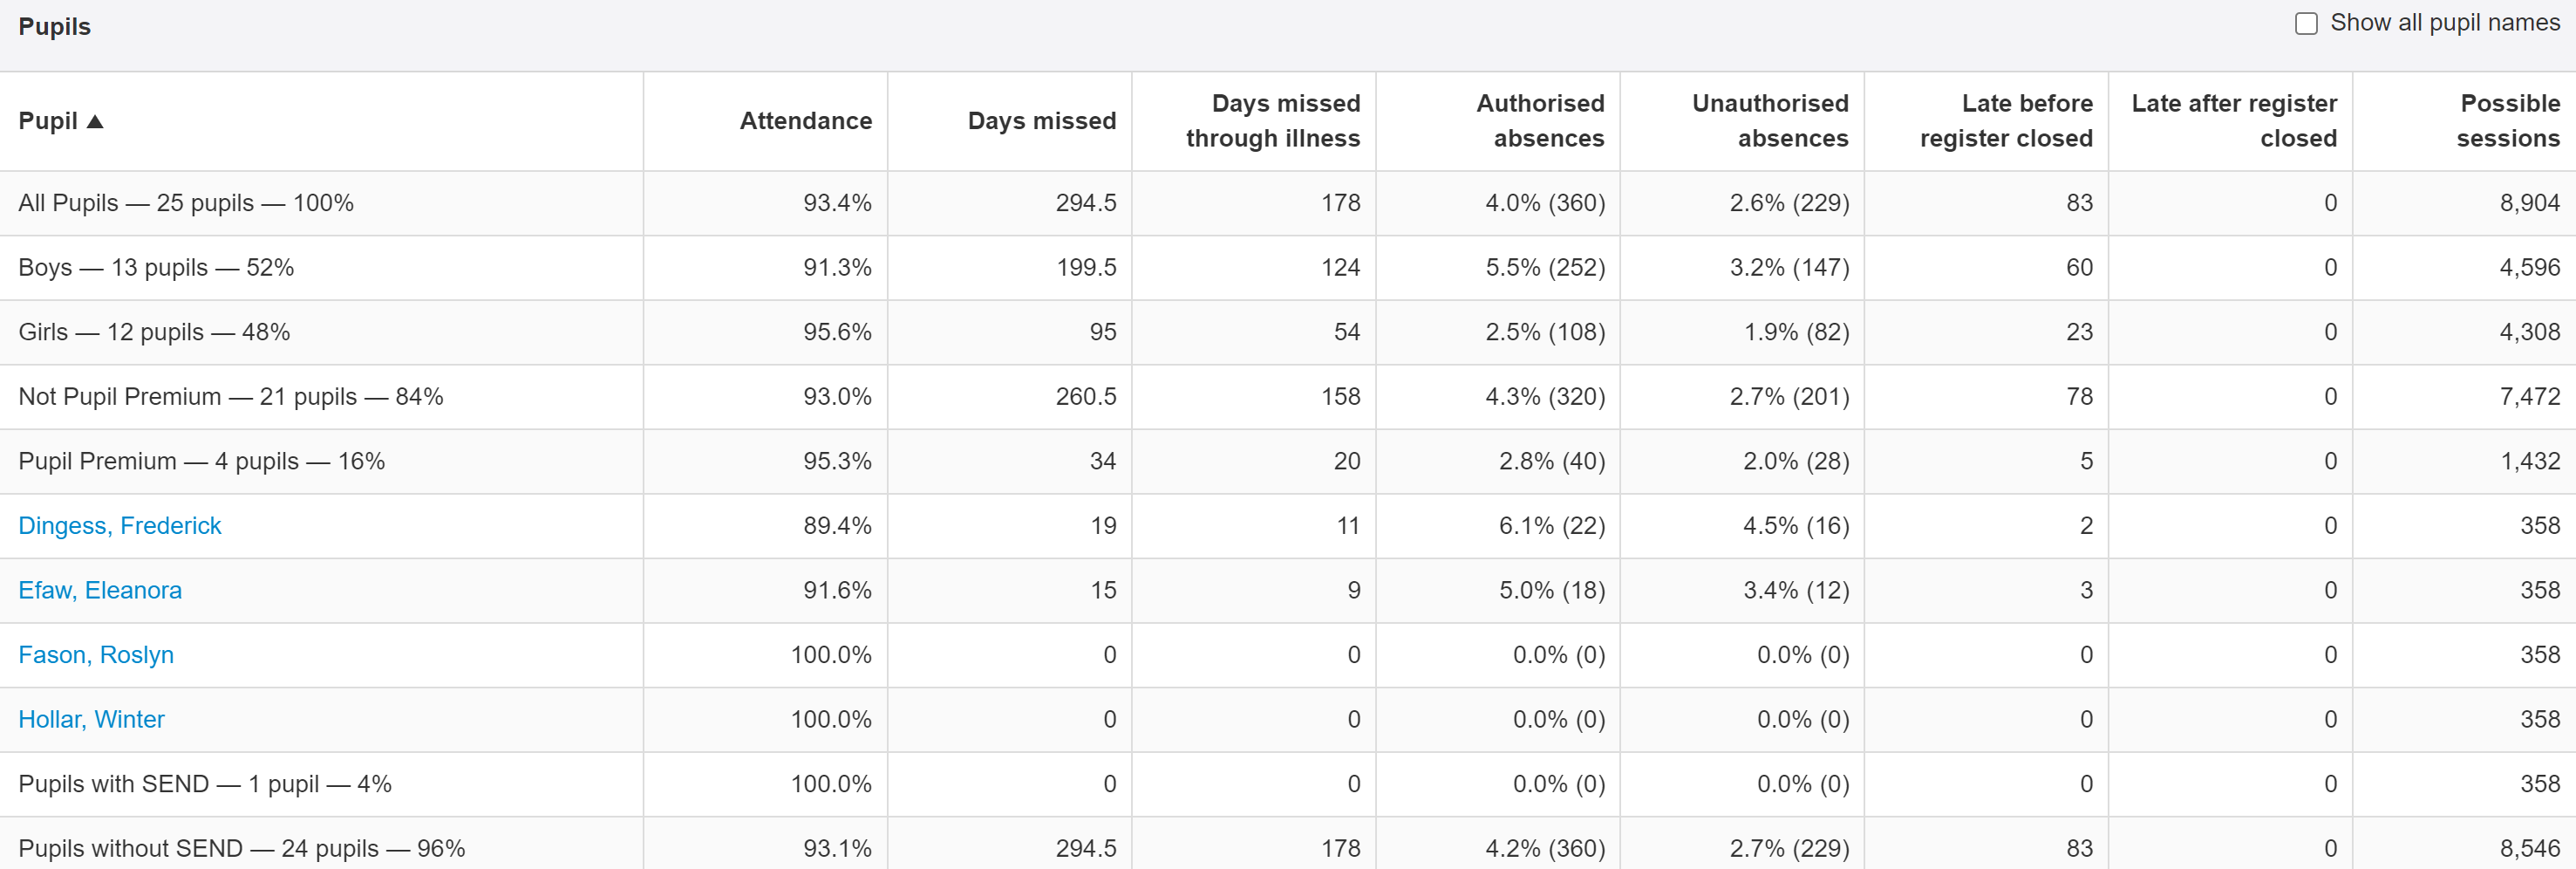
Clicking a row will show the pupil names for that selection or ticking the Show all pupil names box will show names for all.
Each column is also sortable. Click a column heading to toggle between an ascending or descending sort.
Printing the report
Clicking the Print button will produce a print view, with some tweaks to better suit the printed page. This will remove the standard Insight buttons and add a title, including the description of any applied filters.
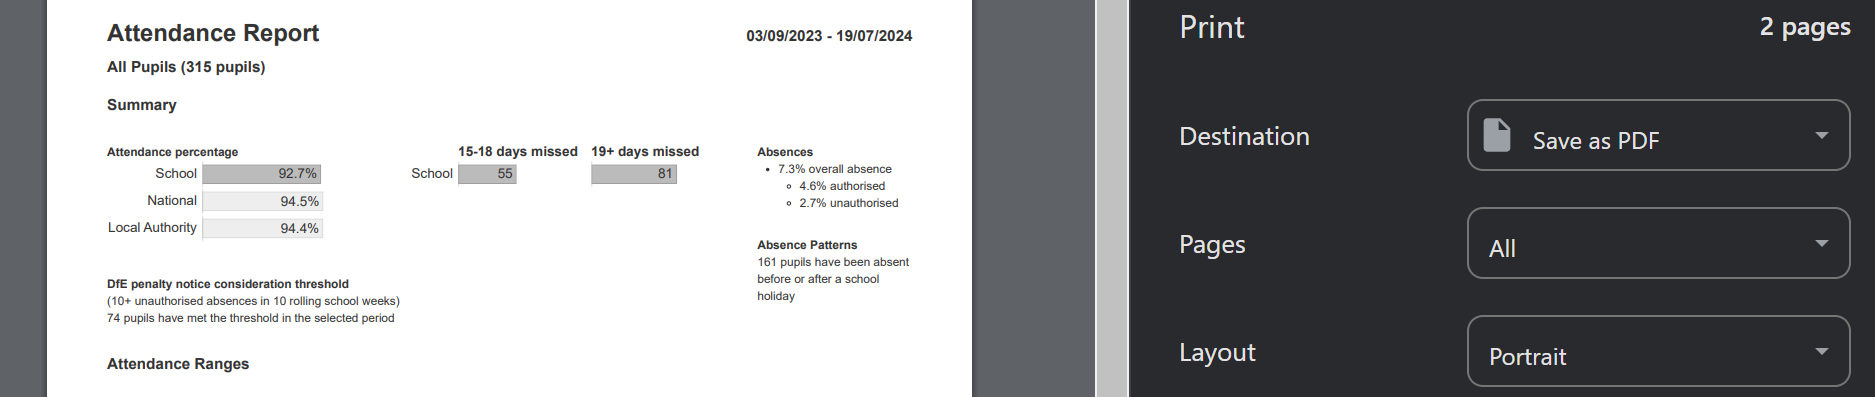
The print view always includes a desciption of any applied filter and the number of pupils represented by the report.
The print view is also useful to export as a PDF if you want to share the report with others.
Matching with third party reports
There are many other sources for attendance data. Your MIS, IDSR or DfE toolkit, for example, all include % attendance values. Those values may not always precicely align with those you see in Insight.
The focus of the attendance reports, in Insight, is on supporting you to make positive action decisions about the pupils in your setting. For that reason, Insight will seek to include pupils in the reports where it can.
The attendance reports, in Insight, are for on-roll pupils only. They do not include pupils who have left the school. You can use the On Roll As Of filter to achieve this, however, although Insight will only know about pupils who have left during your subscription to Insight (through the Wonde sync).
Aggregate reports in other systems may differ slightly. For example, DfE reports will always exclude pupils who are not 5 years old or above on the 31st August in any given academic year. This includes data for terms and weeks later in the school year. The Exclude non-compulsory school age pupils option, in Insight will do so while respecting the date range you choose. So choosing the summer term, in Insight, will include all pupils who are 5 years old on the start date of your date range.
Usually, Insight attendance reports will only include pupils who are on roll. If you want to include leavers, for example, if you're running the report for a particular term, you could use the On-Roll filter to achieve this.
Similarly, the Ofsted IDSR may only include a single term of attendance data for some academic years, depending on the revision.
For MIS systems, it is also possible that their aggregate data in attendance reports includes pupils who are no longer at the school.
And there may just be some small differences due to rounding.