Pupil Attendance report
 Updated
The Pupil Attendance tab provides individual pupil attendance data and analysis. It enables you to compare individual attendance with national, and other, measures and highlight attendance patterns.
This guide details the content of the report, how it is calculated and how it might be used.
If you'd like a complete video guide to analysing attendance data, we posted a webinar recording from October 2024.
Time frame selection
By default, the report shows the data for the current academic year to date.
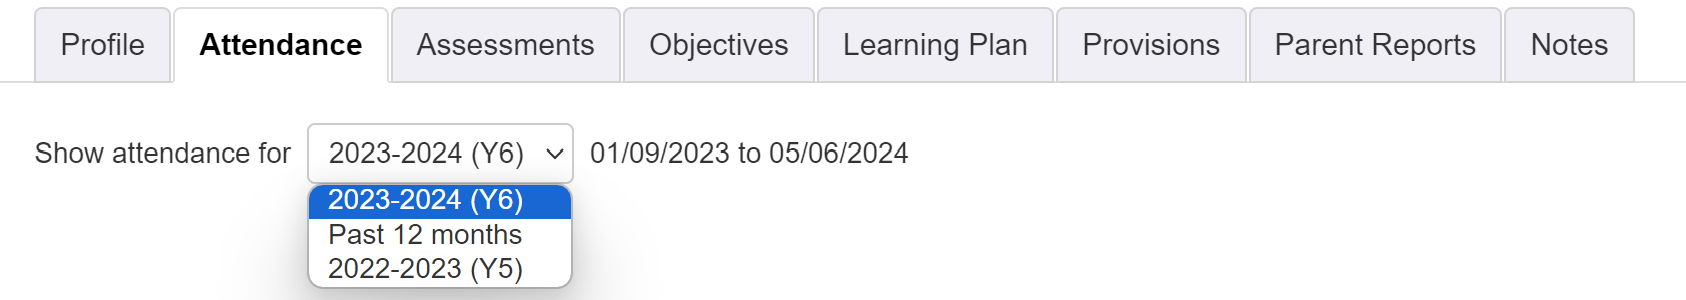
You can also choose to look at the data for the Past 12 months. This is particularly useful in the Autumn term, as it will include dates before the Summer holiday, in the previous academic year.
It is also possible to look at data for the previous two, complete, academic years.
Any gaps may be due to gaps in the data coming from the MIS, so it's worth double-checking if this is the case.
Attendance Summary
The summary section gives you a breakdown of pertinent attendance data. It includes percentages and also, in keeping with DfE advice, focusses on school days missed due to absence.
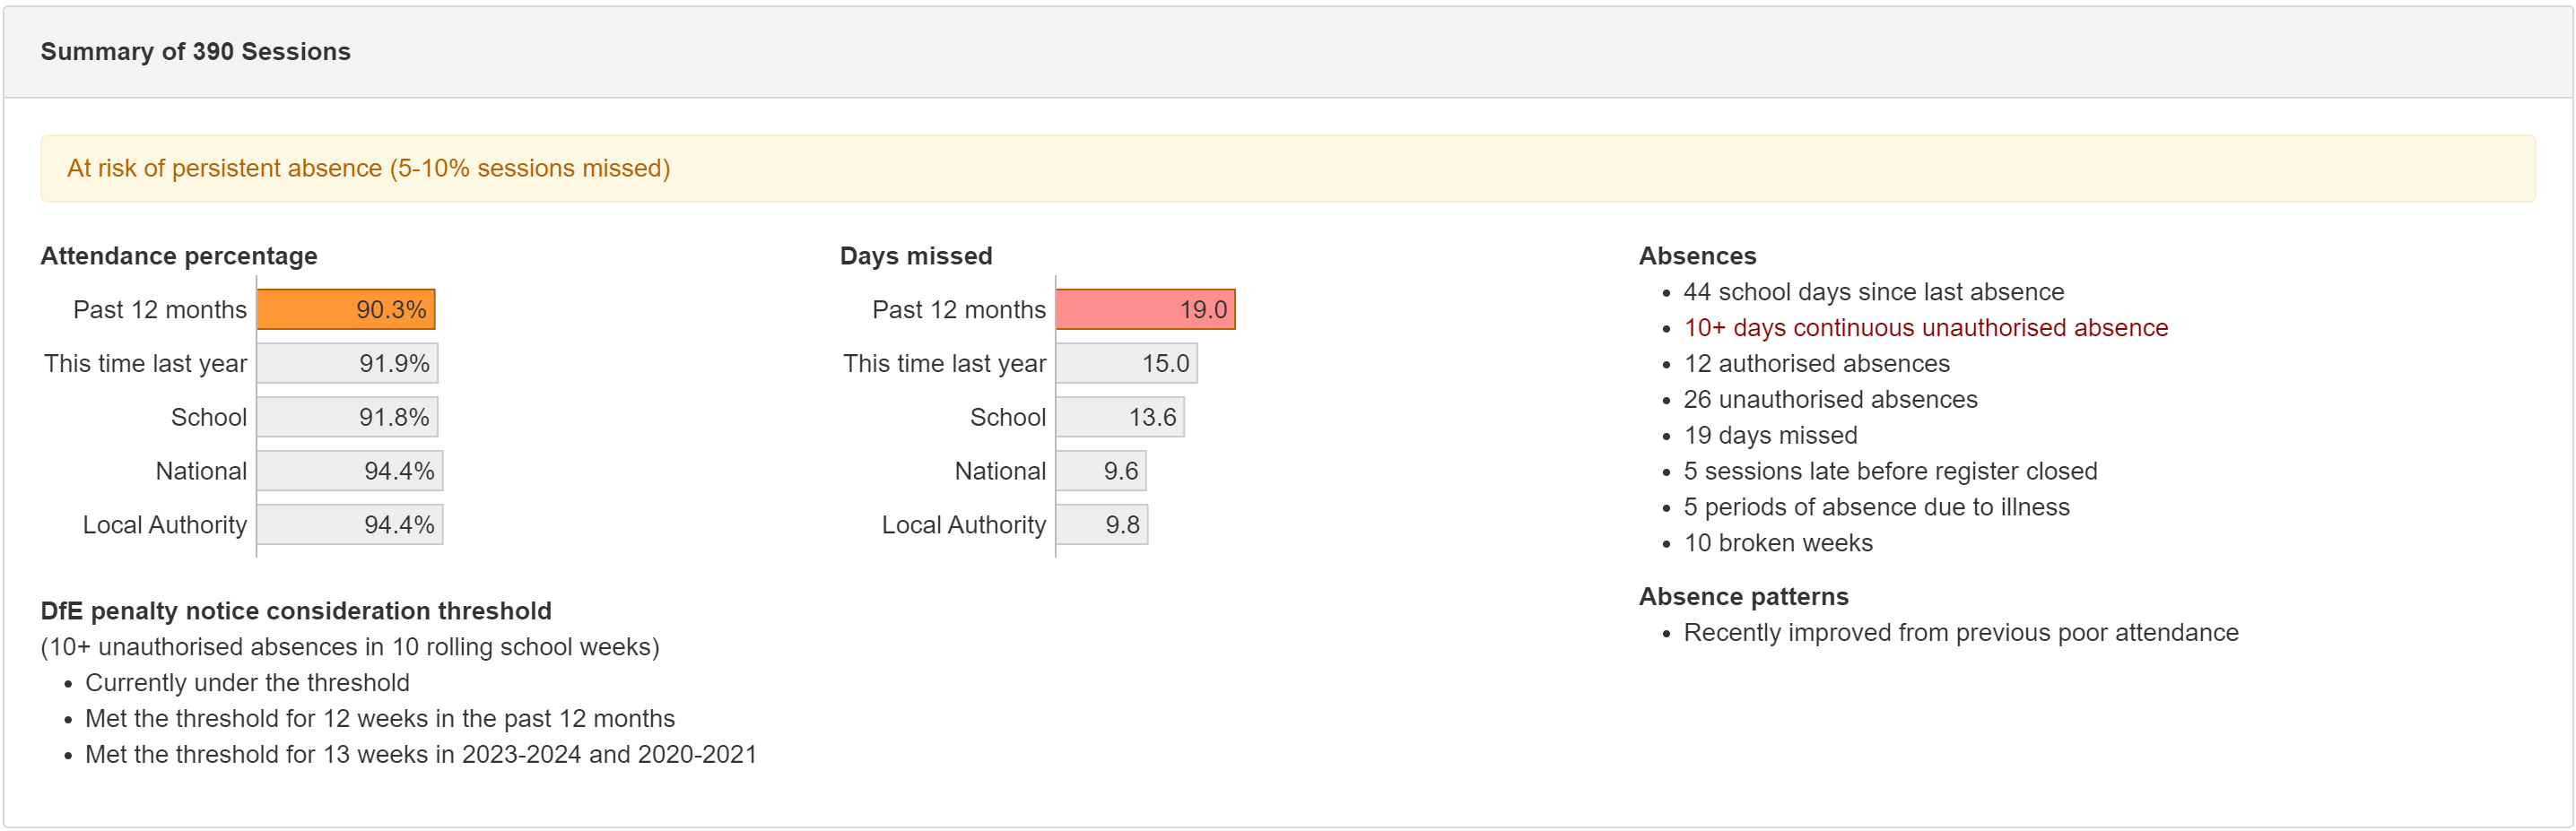
To give you the context, very useful if printing or exporting, the header gives the total number of sessions included in the calculations. A session represents a half day.
Attendance threshold banner
Beneath the header, a banner is displayed detailing the headline information regarding the attendance for the selected pupil. This is based on the Attendance Thresholds you have set for your school. The banner will reflect whichever attendance threshold the pupil is within and be colour shaded accordingly.
Attendance percentage
The bars will update based on your time period selection.
- Upper bar - The label reflects your time period selection, e.g. 2023-2024 (Y6). If you're looking at the current academic year, this displays the current total percentage attendance for the academic year. If you choose to view the Last 12 months, it is the total percentage over 12 months, including before the summer holidays where appropriate. If you choose to view the previous academic year, it's the total for that year.
- This time last year - Gives the attendance % on the same date last year. If you're viewing an academic year, it will be the percentage for the previous academic year up to that date. This can be useful to see if the pattern for this year was similar, at this point, last year. If you're viewing the Last 12 months, it will be the total percentage for the 12 months prior to that, including before the summer holiday. This bar will only display if you have attendance data for that period.
- School - Shows the total attendance percentage for the school, for the selected time period.
- National - Shows the national total attendance percentage for English state funded Primary or Secondary schools (depending on the year group of the pupil), for the selected time period.
- Local Authority - Shows the total attendance percentage for English state funded Primary schools or Secondary schools (depending on the year group of the pupil) in your Local Authority, for the selected time period. Hover over the Local Authority label to check the Local Authority is the correct one. If your school is not part of a Local Authority, this bar will not display.
Days missed
The Days missed bar chart functions in the same way as the Attendance Percentage chart, but displays total days missed. In effect, this is the total number of sessions missed divided by two. All absences are considered here, not just unauthorised ones.
When a pupil reaches 19 days missed, in the upper bar, it will highlight red, as the pupil will now be a persistent absentee, for the year, regardless of attendance from that point onwards.
The School, National and Local Authority values are all calculated using their respective attendance percentage.
For example, if the school attendance percentage is 95% that means 5% of sessions were missed on average. If the total possible sessions is 200 then that means 10 sessions. As each session represents a half day, then this would be 5 days missed for the school average.
For the School Days Missed, Insight uses the same date range as the available national data to make the comparison meaningful. National data is often two weeks behind the current date.
Absences
This section provides a number of absence statistics, for the pupil. Only the applicable ones will be displayed, as follows.
- Number of school days since last absence - For the selected data range, this counts the number of unique dates with at least one possible attendance session between the date of the last absent session and the date of the latest available record.
- 10+ continuous days absence - If a pupil has had a period of 10 continuous days unauthorised absence, in the selected date range, it will be indicated here. A requirement for some local authority attendance returns, this is described on page 21 of the DfE Working together to improve school attendance document. The considered time period is the selected date range only. For example, with the current academic year selected, a pupil with 5 continuous days absence last academic year will not meet the threshold if they have a further 5 continuous days absence at the start of the current academic year. As per the DfE specification, the first unauthorised session we include in the data can be an afternoon session, if it starts a period of 20 continuous sessions of unauthorised absence.
Click to see details of the first and last absence dates, and the total sessions absent. The last absence date will be blank if the latest data indicates that the pupil has yet to return to school. If a pupil has had multiple periods of 10+ continuous days absence, in the selected date range, they will all be shown here.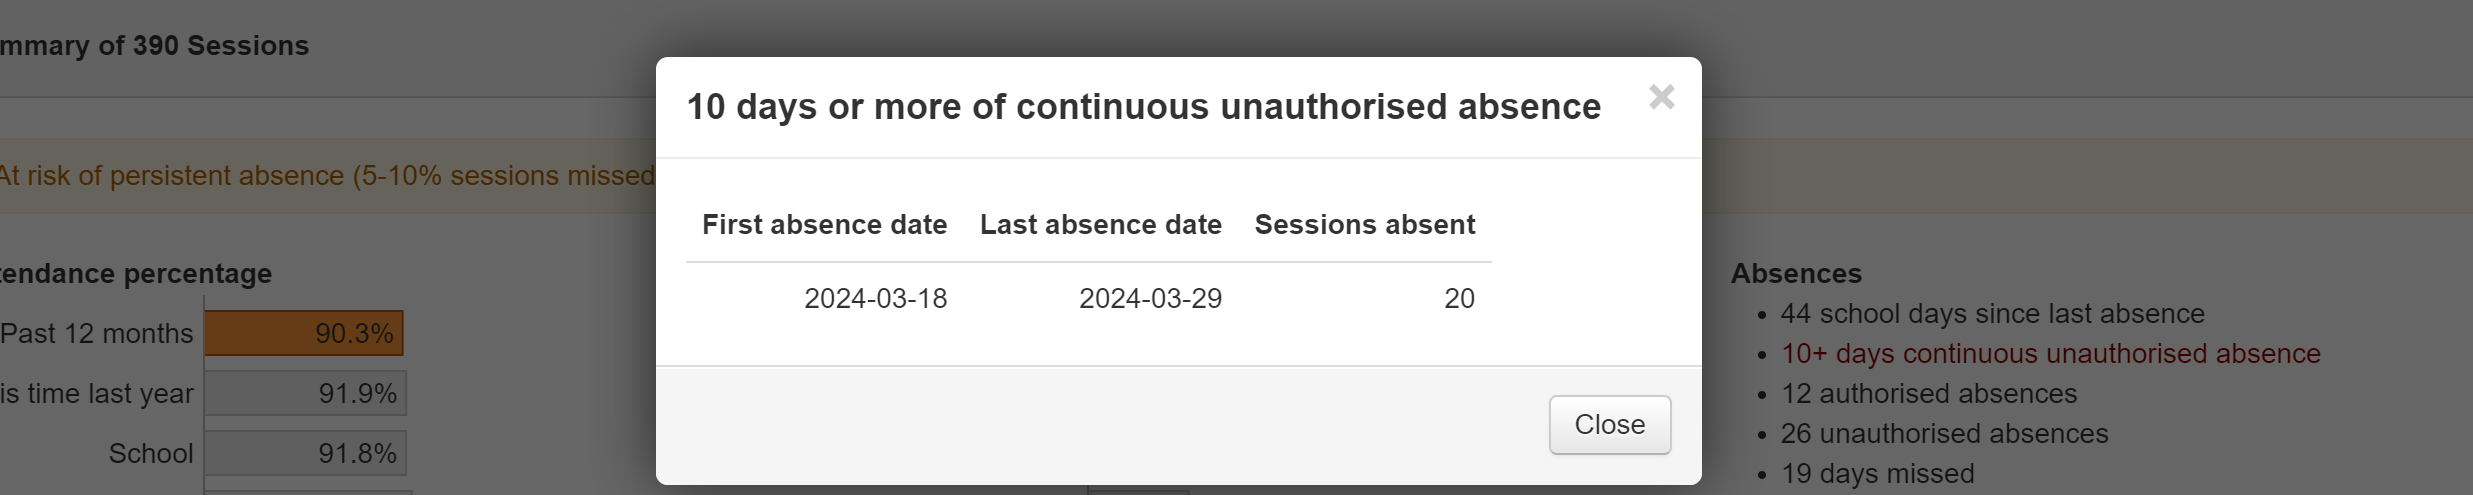
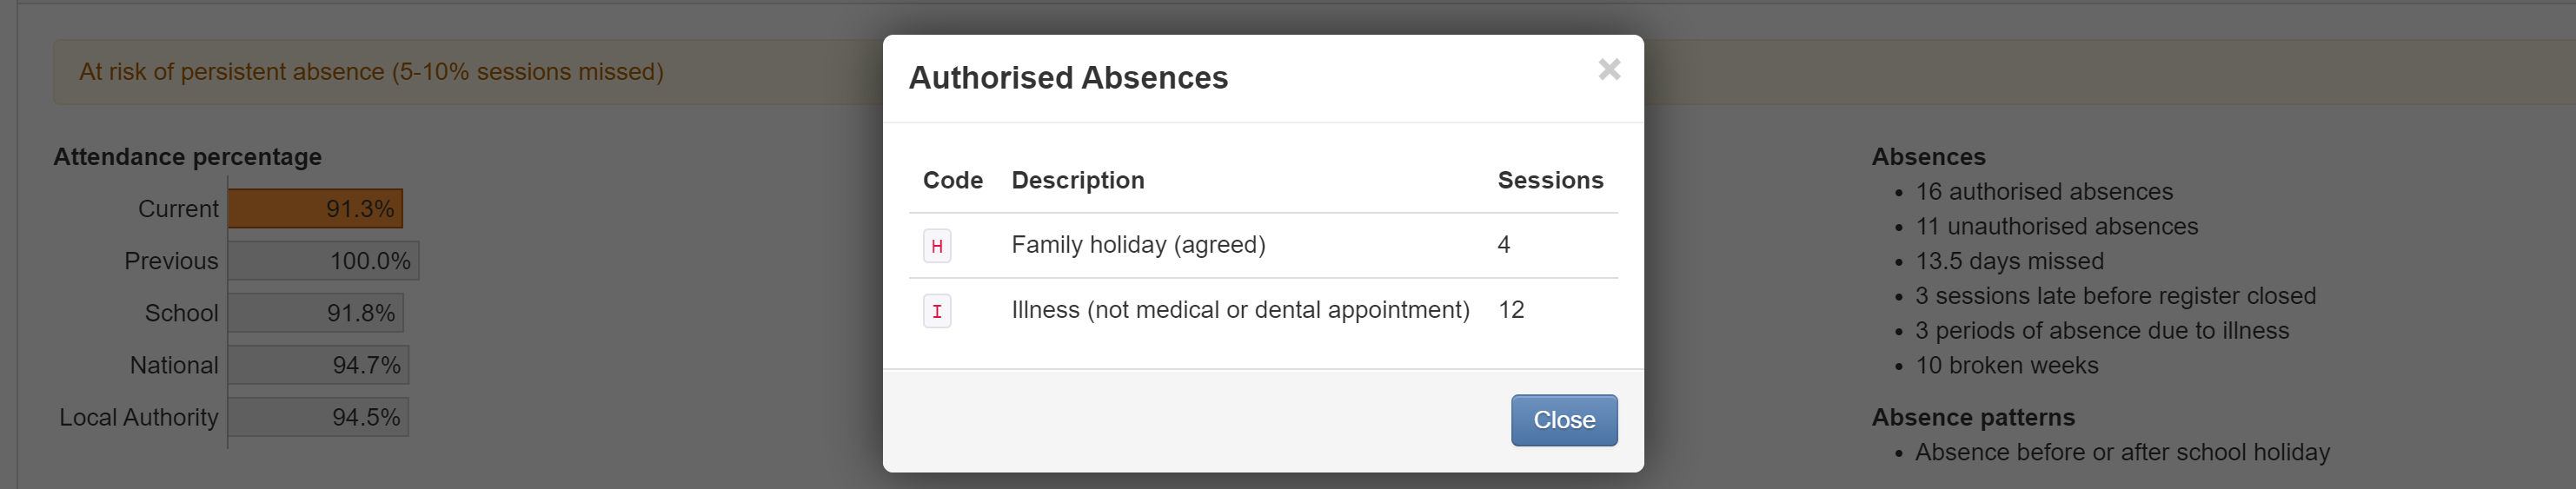
- Number of authorised absences - Click to see the breakdown of which codes were used for each absence.
- Number of unauthorised absences - Click to see the breakdown of which codes were used for each absence.
- Number of days missed - Click to see the breakdown of whole days missed or where the pupil only missed a half day.
- Number of sessions late before register closed - This is a count of all sessions marked with the L attendance code in the register.
- Number of periods of absence due to illness - This is a count of the number of blocks of absence due to illness (so marked with the I code in the register). If a pupil is absent before and after a weekend, this is counted as one period of illness. If a pupil is absent before and after a school holiday (including half term breaks) this is counted as two periods of illness.
- Number of broken weeks - This is a count of the number of school weeks in which the pupil missed one or more sessions.
Absence Patterns
This section will appear, for a pupil, if they meet one or more of these defined patterns.
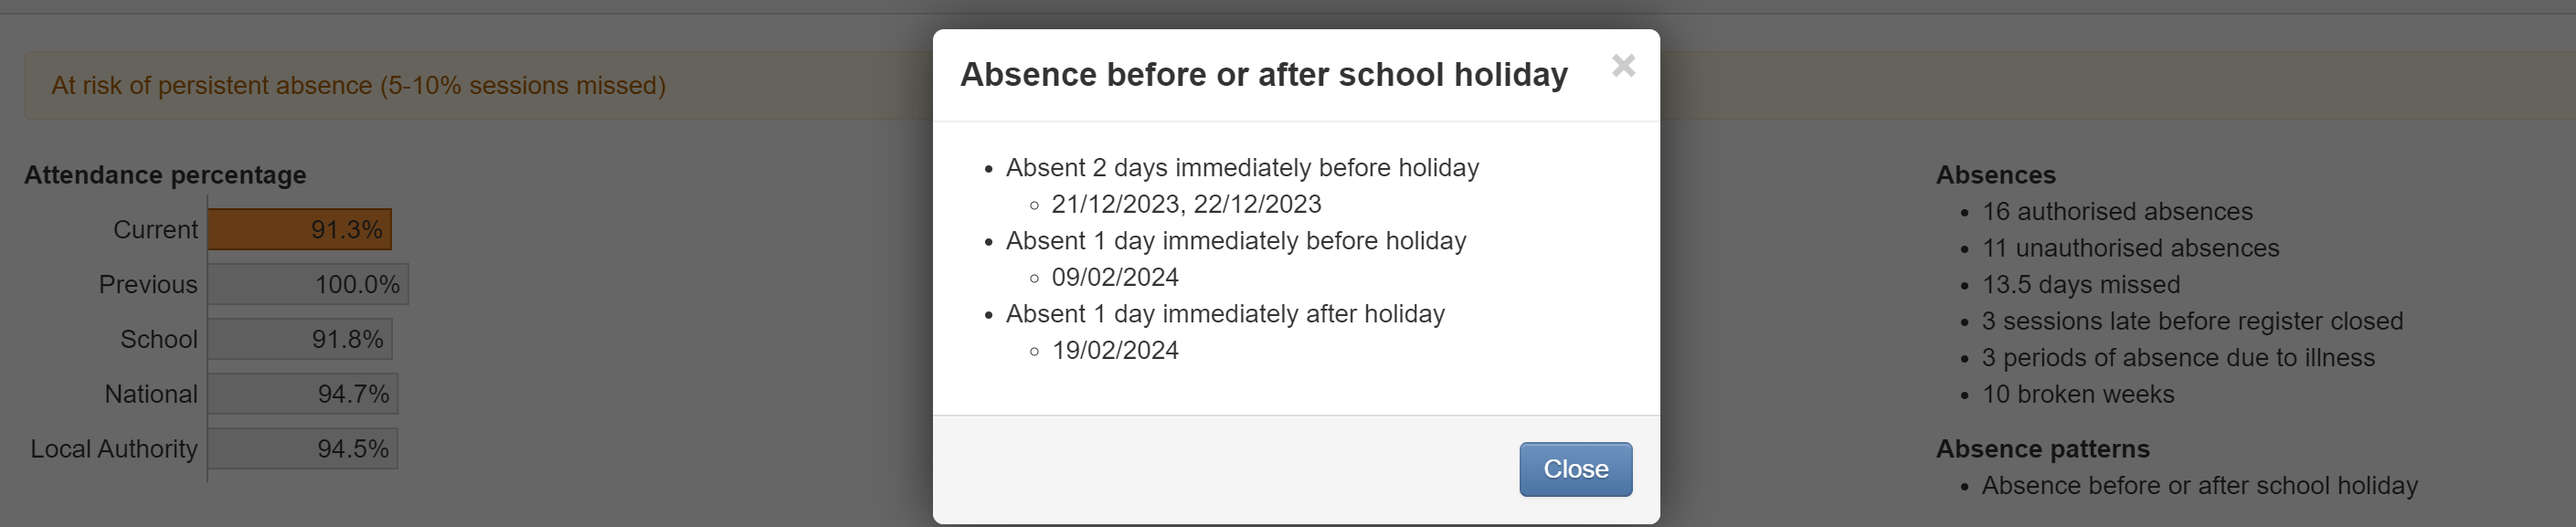
- Absence before or after a school holiday - A pupil meets this pattern if they have one or more sessions absent immediately before or after a school holiday. Click to see the absences listed.
- Repeatedly late or absent on the same day - A pupil meets this pattern if they're late (L or U code) to school or absent (authorised or unauthorised) on the same day of the week at least 5 times, and for more than 30% of the total number of that day in the selected period. E.g. L or U on 5 of 10 Wednesdays in the defined period would meet the threshold.
Click to see the days listed. If there are other days when the pupil has been late or absent, these will also be listed, even if they're under 30%.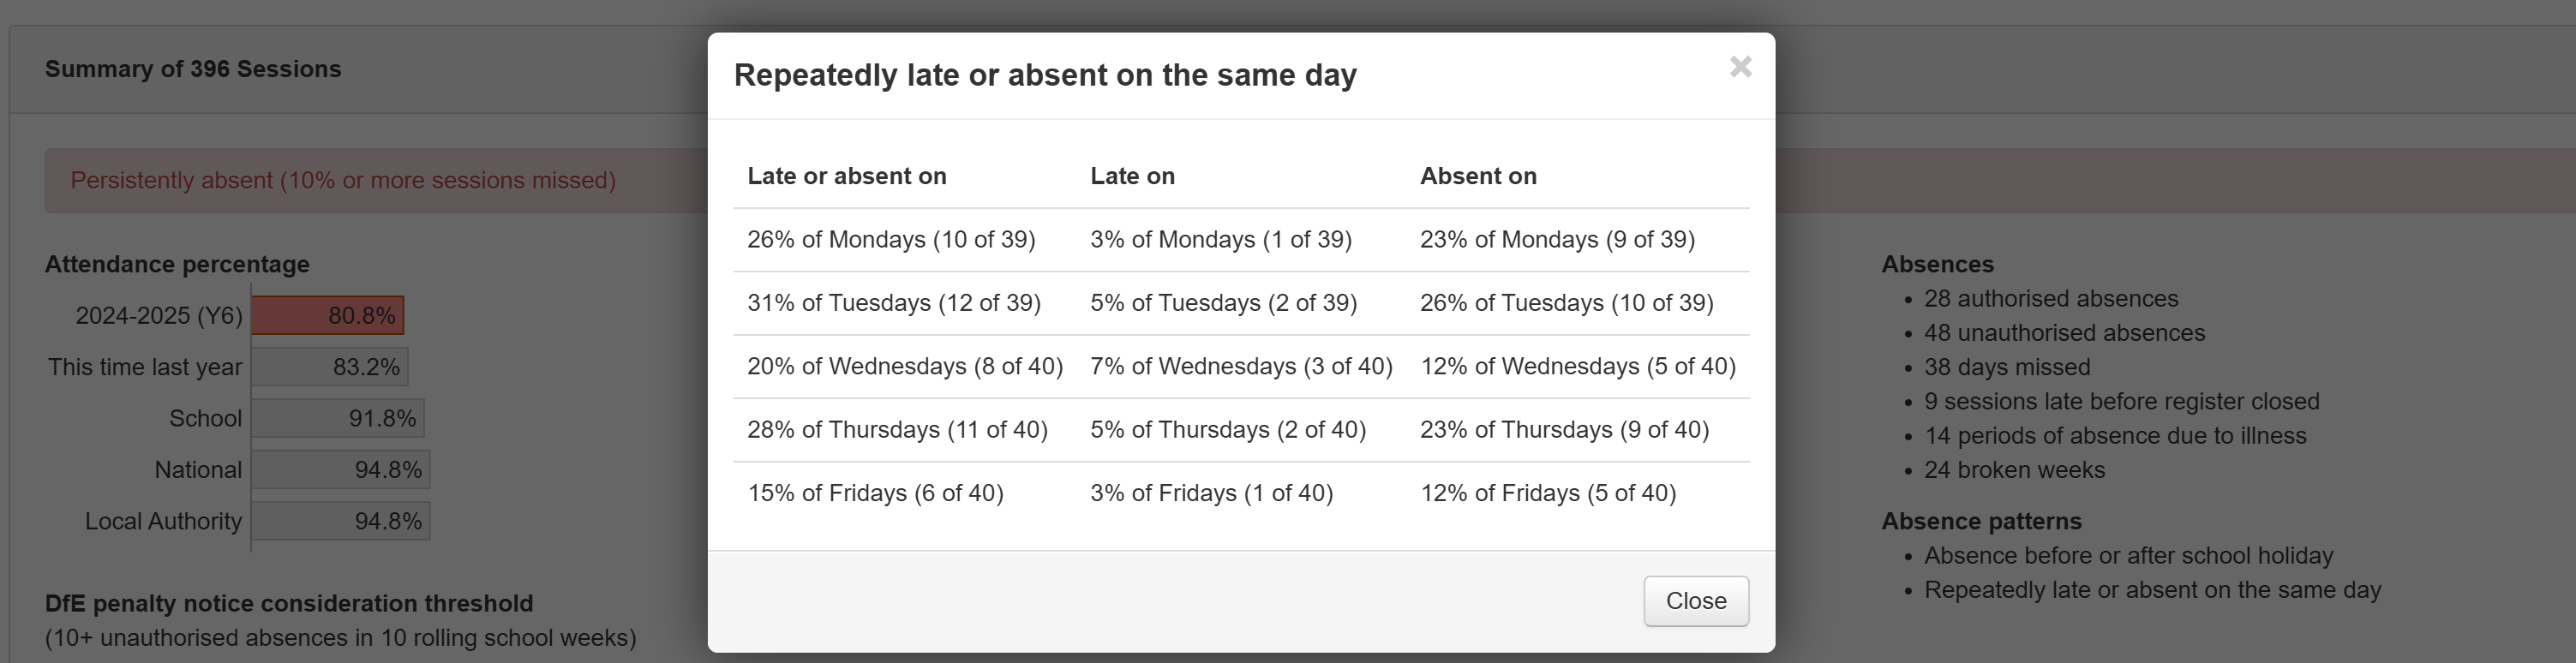
- Recently worsened from previous good attendance - This is designed as a possible early intervention indicator, before attendance dips into Persistent Absence. It identifies pupils with good attendance historically but recent absences that may be indicative of a change in behaviour. A pupil meets this pattern if:
- Total range of the selected period must be greater than 8 weeks, excluding school closure, and have an end date within the current academic year.
- They must have missed 6 or more sessions in the last 4 weeks of the selected period.
- Overall attendance % for the rest of the selected period must be greater than 95%.
- Overall attendance % for the academic year must not be more than 97%.
- Recently improved from previous poor attendance - This is designed to highlight pupils with improving attendance in order that this change in behaviour may be recognised and encouraged. A pupil meets this pattern if:
- Total range of the selected period must be greater than 8 weeks, excluding school closure, and have an end date within the current academic year.
- They must have missed 2 or fewer sessions in the last 4 weeks of the selected period.
- Overall attendance % for the rest of the selected period must be below 90%.
DfE "10 in 10" penalty notice consideration threshold
The DfE define the following national threshold, which is a statutory part of any attendance fine consideration for schools from August 2024.
All state funded schools must consider whether a penalty notice for absence is appropriate in each individual case where one of their pupils reaches the national threshold for considering a penalty notice. Schools should not have a blanket position of issuing or not issuing penalty notices and should make judgements on each individual case to ensure fairness and consistency across the country. The threshold is 10 sessions of unauthorised absence in a rolling period of 10 school weeks. A school week means any week in which there is at least one school session. This can be met with any combination of unauthorised absence (e.g. 4 sessions of holiday taken in term time plus 6 sessions of arriving late after the register closes all within 10 school weeks). These sessions can be consecutive (e.g. 10 sessions of holiday in one week) or not (e.g. 6 sessions of unauthorised absence taken in 1 week and 1 per week for the next 4 weeks). The period of 10 school weeks can also span different terms or school years (e.g. 2 sessions of unauthorised absence in the Summer Term and a further 8 within the Autumn Term).
From Working together to improve school attendance, section 181
A week is considered ‘active’ on the first day in which there is a school session, so considered within the threshold calculation.
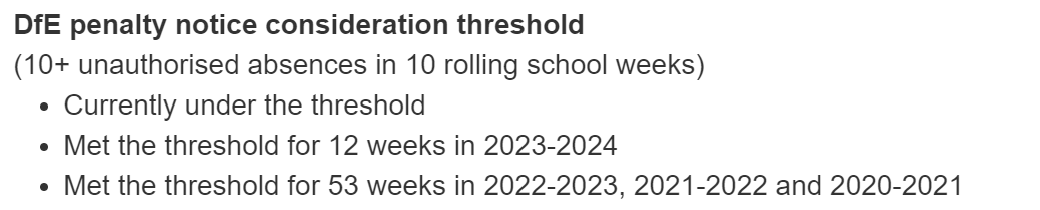
This section will indicate if the pupil currently meets the 10 in 10 threshold. As a pupil could meet the threshold on, for example, Friday, but no longer meet the threshold on the following Monday, it will also be indicated if the pupil met the threshold at any point during the current academic year, or selected time period.
If the pupil also met the threshold during any previous academic years, we have the data for, this will also be displayed. The total number of weeks the threshold was met for is also provided.
Cumulative Attendance Percentage By Week
The chart shows the overall cumulative attendance percentage for each school week.
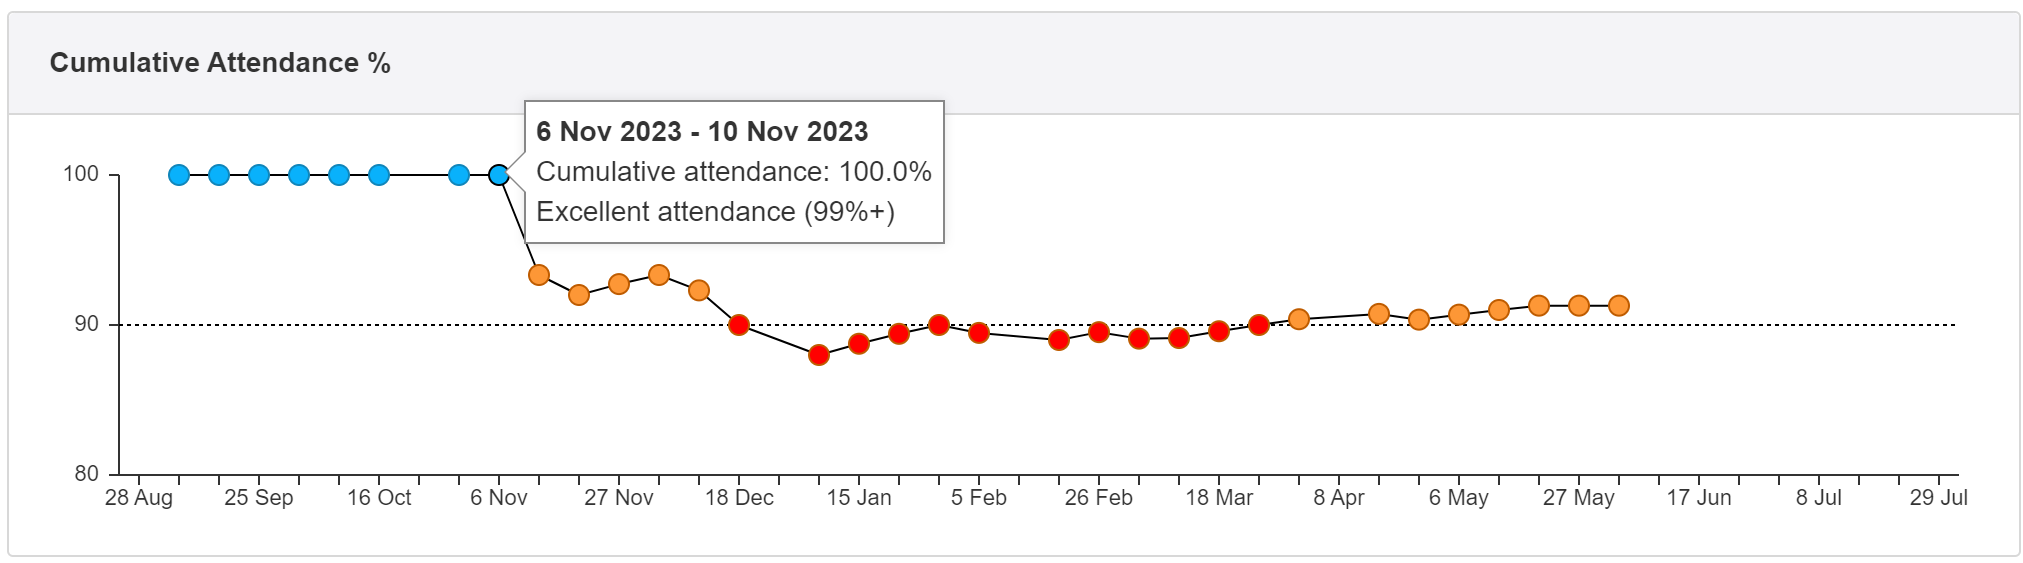
Hovering the mouse over any of the plot points shows the date range (Monday to Friday), the actual cumulative attendance at that point in time and which attendance threshold the pupil was within at that point in time. It will also highlight the appropriate week in the calendar (described below).
The chart is designed to visually demonstrate the long term impact a significant period of absence can have on the overall attendance percentage at the end of the school year.
Weekly attendance
The calendar shows each school day and highlights whether the pupil was present, late, authorised/unauthorised absent on each day.
Holiday weeks are compressed into the single dotted lines for ease of reading.
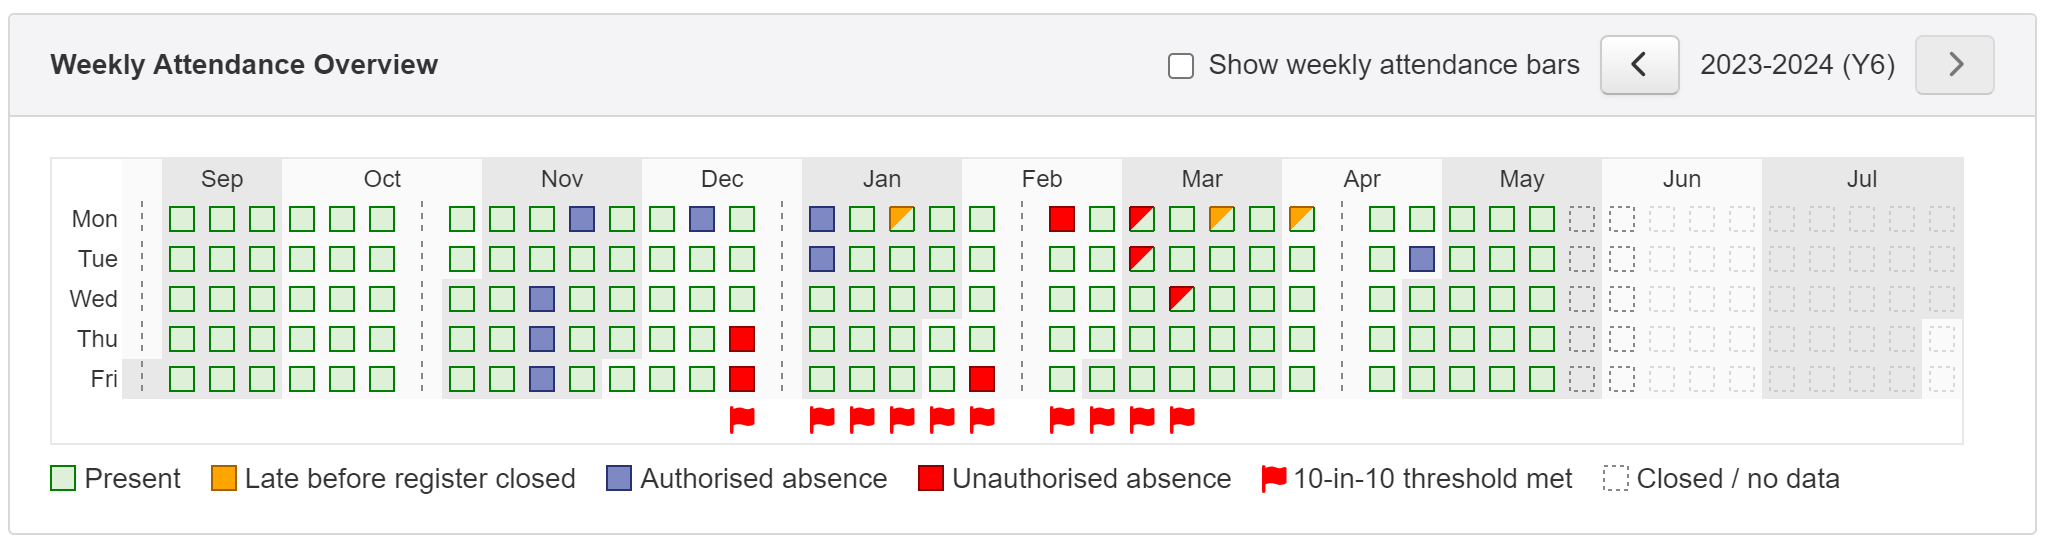
Hovering the mouse over a day will display the actual attendance codes used on that day. It will also highlight the appropriate plot point on the chart above.
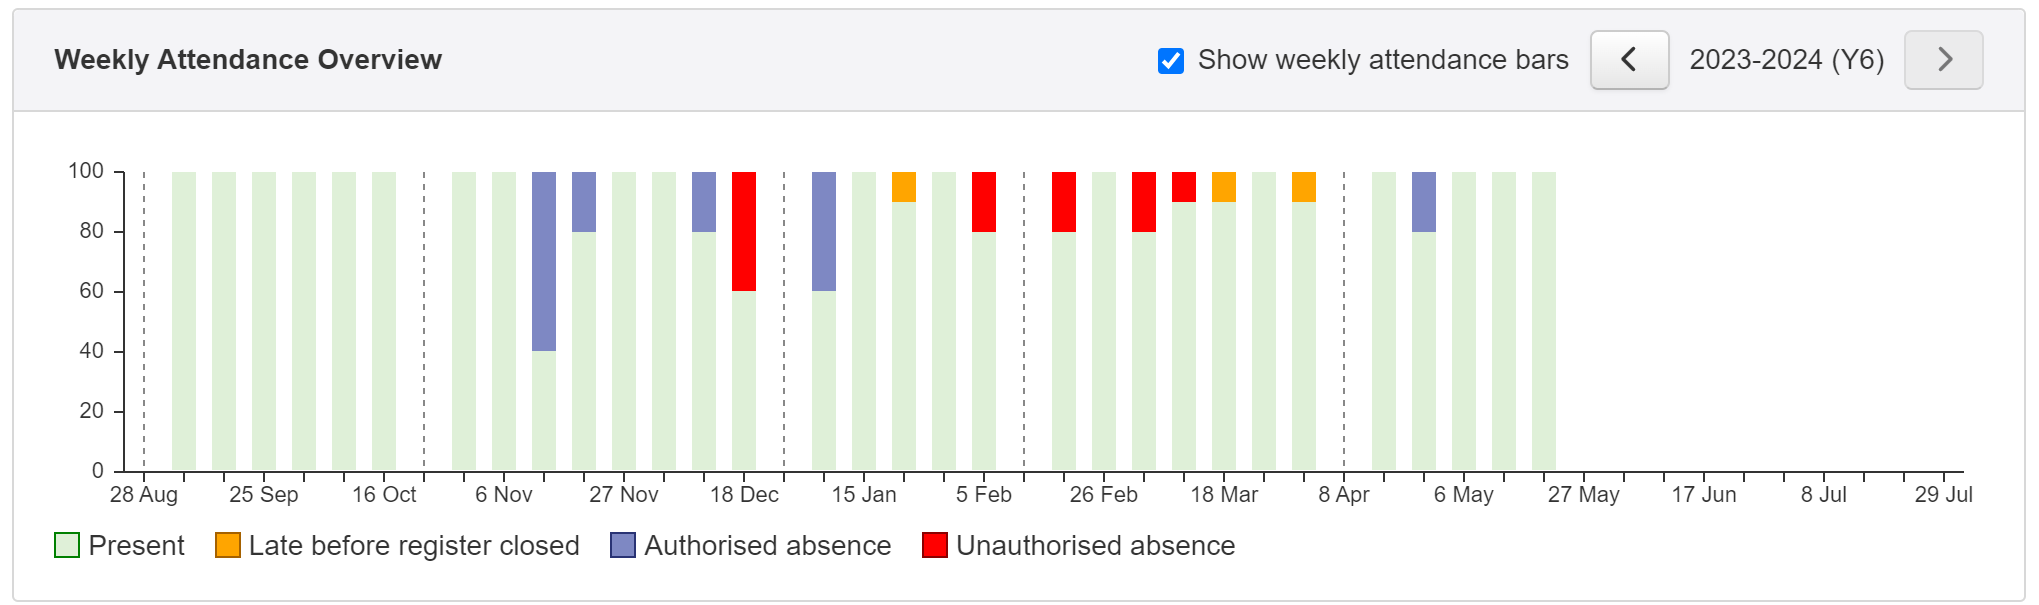
Sometimes, it can be difficult to understand the patterns, particularly if the pupil has a mix of different absences or lates. Tick Show weekly attendance bars to display the calendar as a weekly stacked bar chart.
The left/right arrow buttons may be used to view an earlier/later time period.