Demographics report
 Updated
The Demographics report provides a summary of your school's community. It gives a whole school overview and adds context to other data, which can help explain why standards may differ between cohorts.
The report also includes the standard Filters bar, allowing you to quickly see the representation for a class or Key Stage for example.
When you apply a filter, the national data remains visible, but it should be noted that the values will not change. For example, if you filter to show just boys the national data for Persistent Absence is still all pupils nationally, not the national value for boys.
The report will update, when a filter is applied, to include an asterisk next to all national values and an explanatory note in the footer.
For Trust users, the Demographics report shows data for all the schools in the Trust.
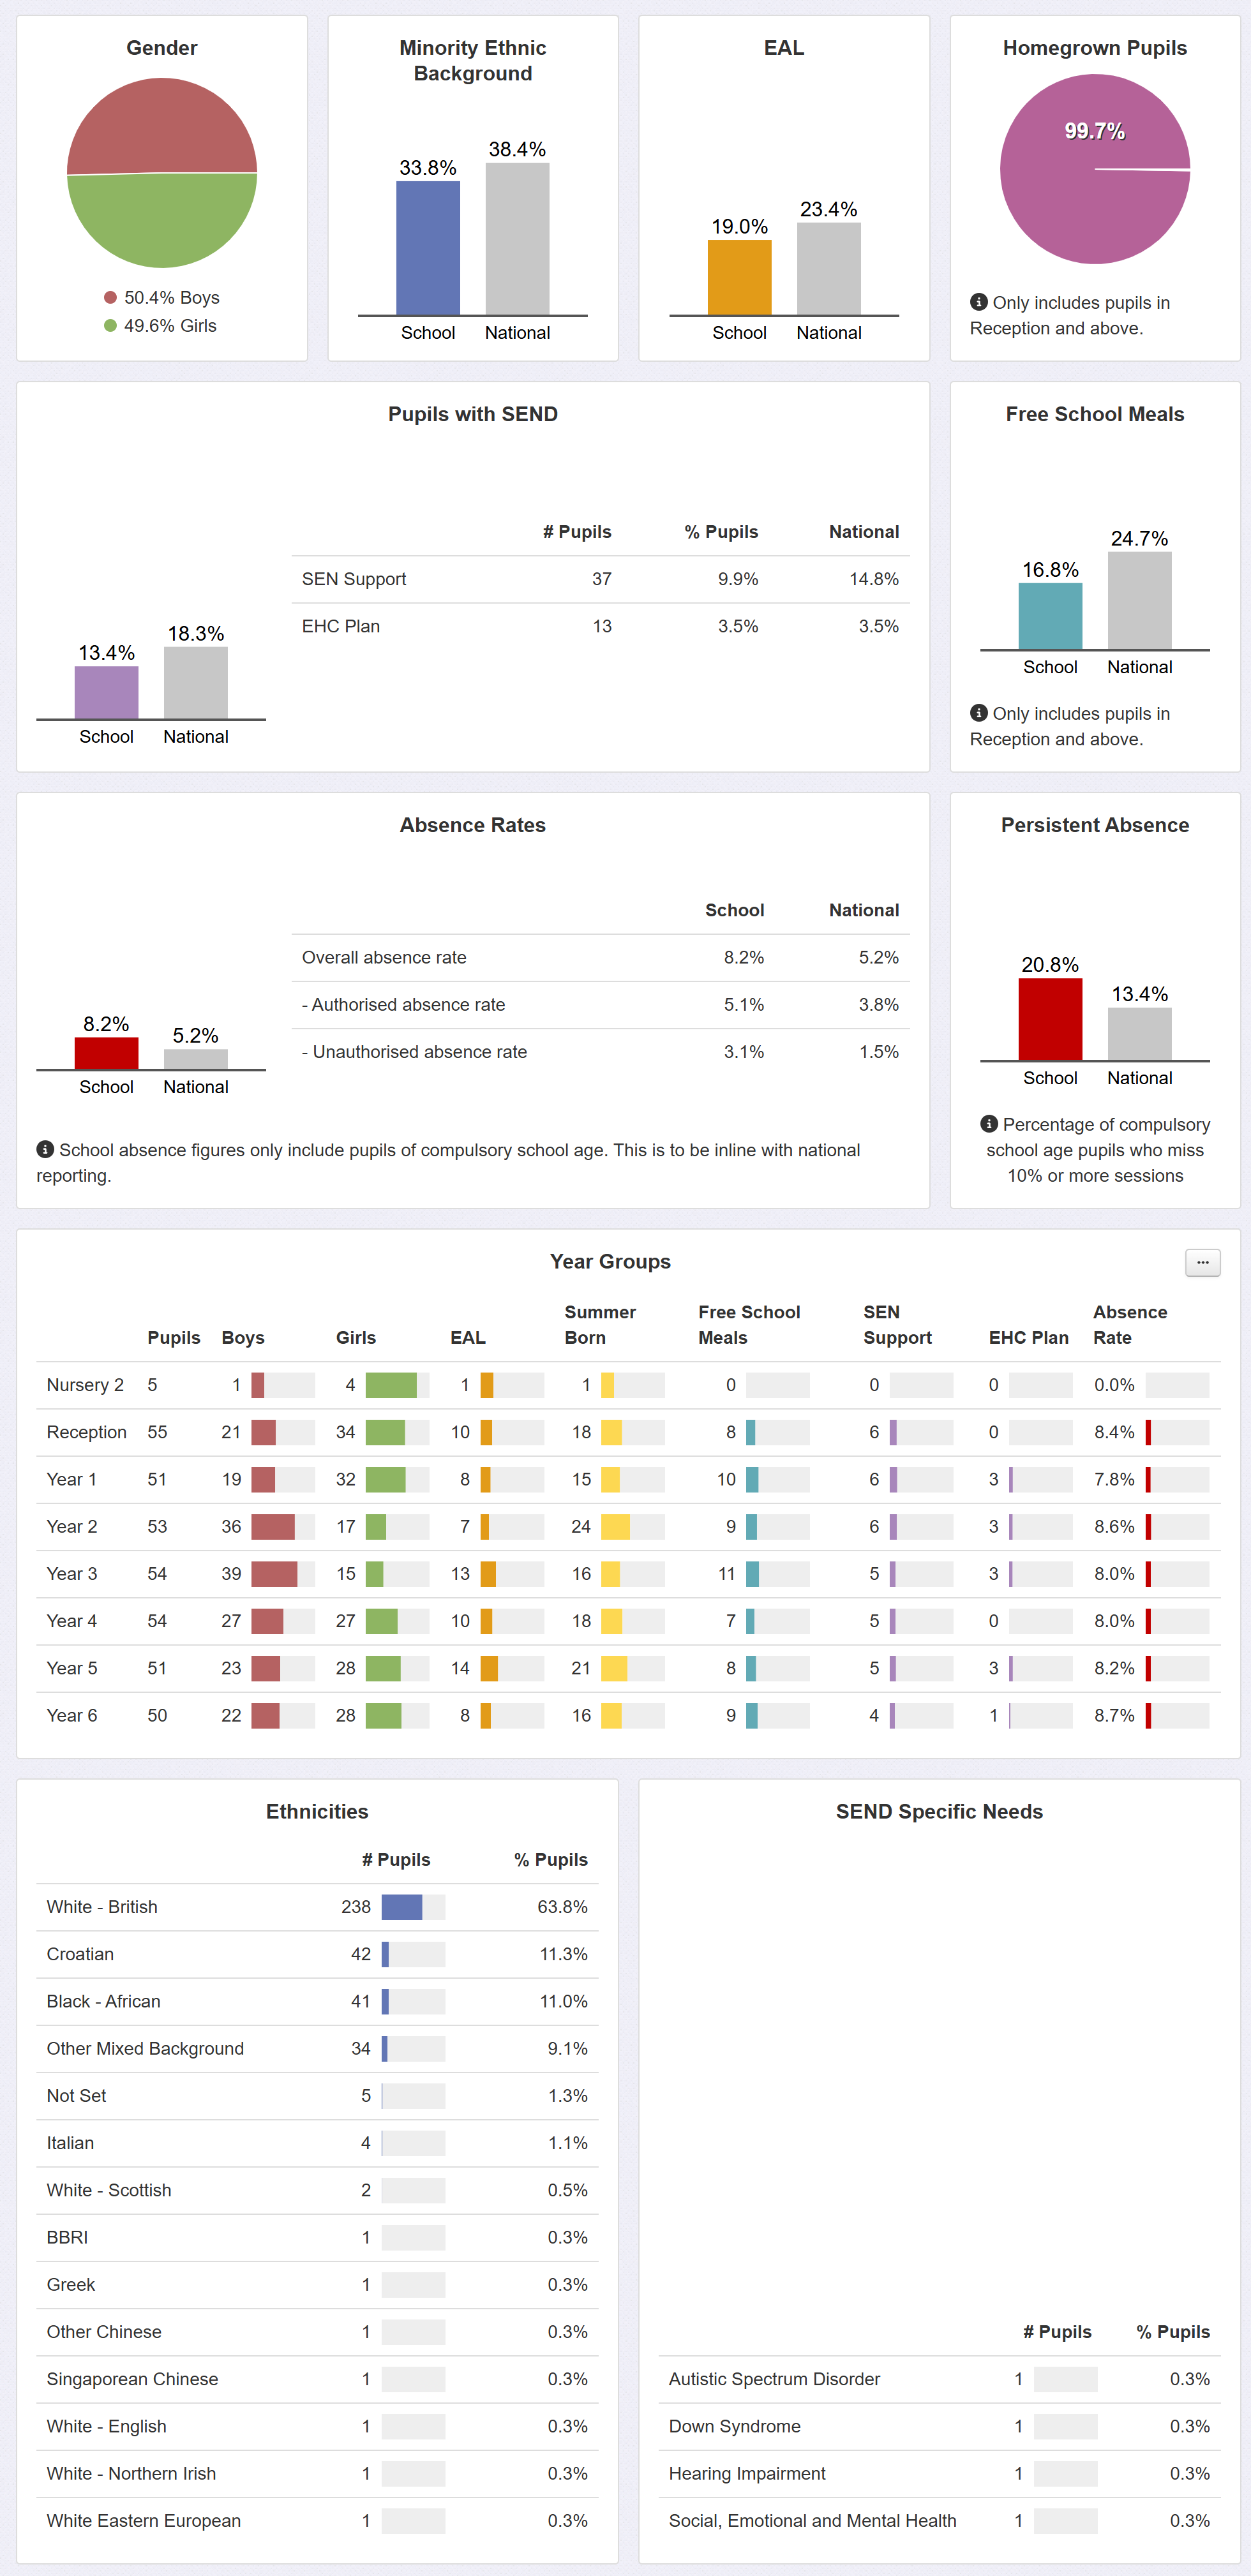
The top half of the report is devoted to a whole school/Trust summary which includes:
Ratio of boys to girls
% Minority Ethnic Background
As per the DfE definition, any pupils whose ethnicity is not White British (WBRI) or any of the extended codes as below:
DfE Codes | Ethnicity |
WBRI | White - British |
WCOR | White - Cornish |
WENG | White - English |
WNIR | White - Northern Irish |
WSCO | White - Scottish |
WWEL | White - Welsh |
WOWB | Other White British |
% EAL
% of "Homegrown" pupils
Those that joined the school in reception or lower (or Year 3 if a junior school).
This is the % of pupils whose school start date is at any point in their Reception year (or Year 3) or earlier.
For the Trust version of the report, the section also respects each school's start year group, meaning a combination of Primary, Infant and Junior schools will not adversely affect the reported %.
% SEND
With further breakdown to SEN Support and EHCP.
% FSM
Pupils eligible for Free School Meals.
% absence rates
With % sessions missed: overall, authorised, unauthorised.
These figures are the latest available whole academic year values
School absence figures only include pupils in Y1 to Y6. This is to be inline with national reporting where the "measures are calculated for pupils who are of compulsory school age - ie aged between 5 and 15 as at the start of the academic year (31 August)." Reception pupils are not 5 at the start of the academic year.
Overall absence is calculated by taking the sum of absent sessions for each pupil, then dividing by the sum of each pupil's possible sessions
Overall absence rate = (Unauthorised + Authorised) / Possible x 100
Authorised absence rate = Authorised / Possible x 100
Unauthorised absence rate = Unauthorised / Possible x 100
% persistent absence
% of pupils that have missed 10% or more sessions.
This is calculated using the calculation (Authorised Absence + Unauthorised Absence) / Possible Sessions >= 10%.
Pupils are included in the calculation if they are of compulsory school age - ie aged between 5+ at the start of the academic year (31 August). This matches the DfE approach.
The DfE do not produce national persistent absence data in the Autumn term, so this will remain blank until national data is available in Spring.
Where appropriate, national figures are provided for comparison.
For Absence rates and persistent absence, the national values are always the latest available ones from the DfE, when viewing the current academic year. The applicable full academic year values are used if you choose to view a previous academic year.
More details on the national data used in Insight are on our National Statistics page.
Lower section
The bottom half of the report shows a detailed breakdown of Ethnicity and any SEND Specific Needs recorded against the pupils.
It also includes a table showing key characteristics of each year group.
The Trust version has a row for each school.
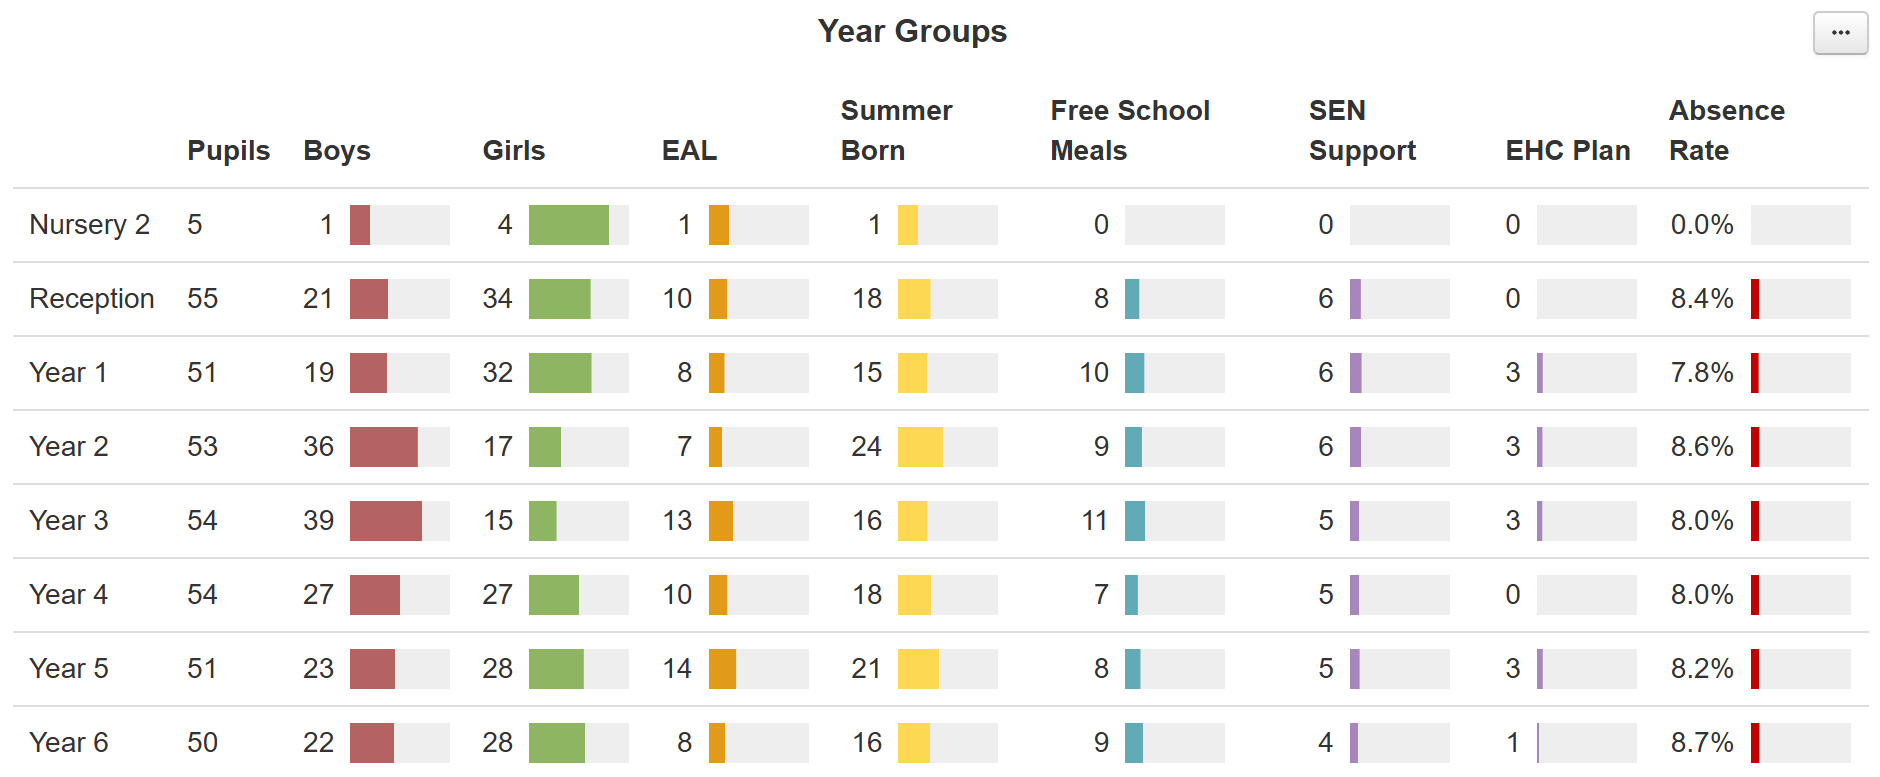
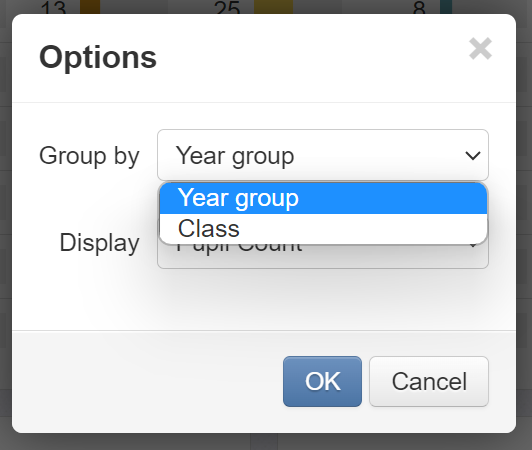
The ellipsis button (...), in the top right, has some options for the display in this table.
You can choose to Group by Year Group (default) or Class. It is also possible to change the display from a pupil count to a percentage view.
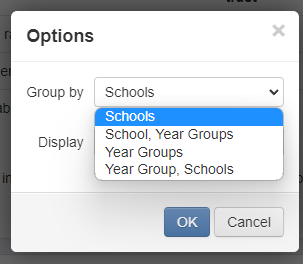
The Trust version of the report allows you to show a breakdown of each school in the Trust or, additionally, show each school including a year group breakdown. You can also choose to show each year group across the Trust or also break each year down by school.
This section quickly reveals groups with notable challenges and is particularly useful when cross-referenced against attainment and progress data as it can help explain disparities in standards across the school.
The Demographics report is especially useful for audiences such as governors and is the perfect complement to other reports such as Statutory Assessment and Headlines.