Statutory Assessments Report
 Updated
The Statutory assessments report provides senior leaders and governors with a quick reference on school standards compared to national figures over the past four years. It fulfils a need currently not met by the DfE's Analyse School Performance (ASP) system or Ofsted's School Inspection Data Summary Report (IDSR).
This guide covers usage of the report and the calculations used to create the displayed data.
The report includes data on the range of statutory assessments from EYFSP through to end of Key Stage 2 Statutory Assessments.
Using and understanding the report
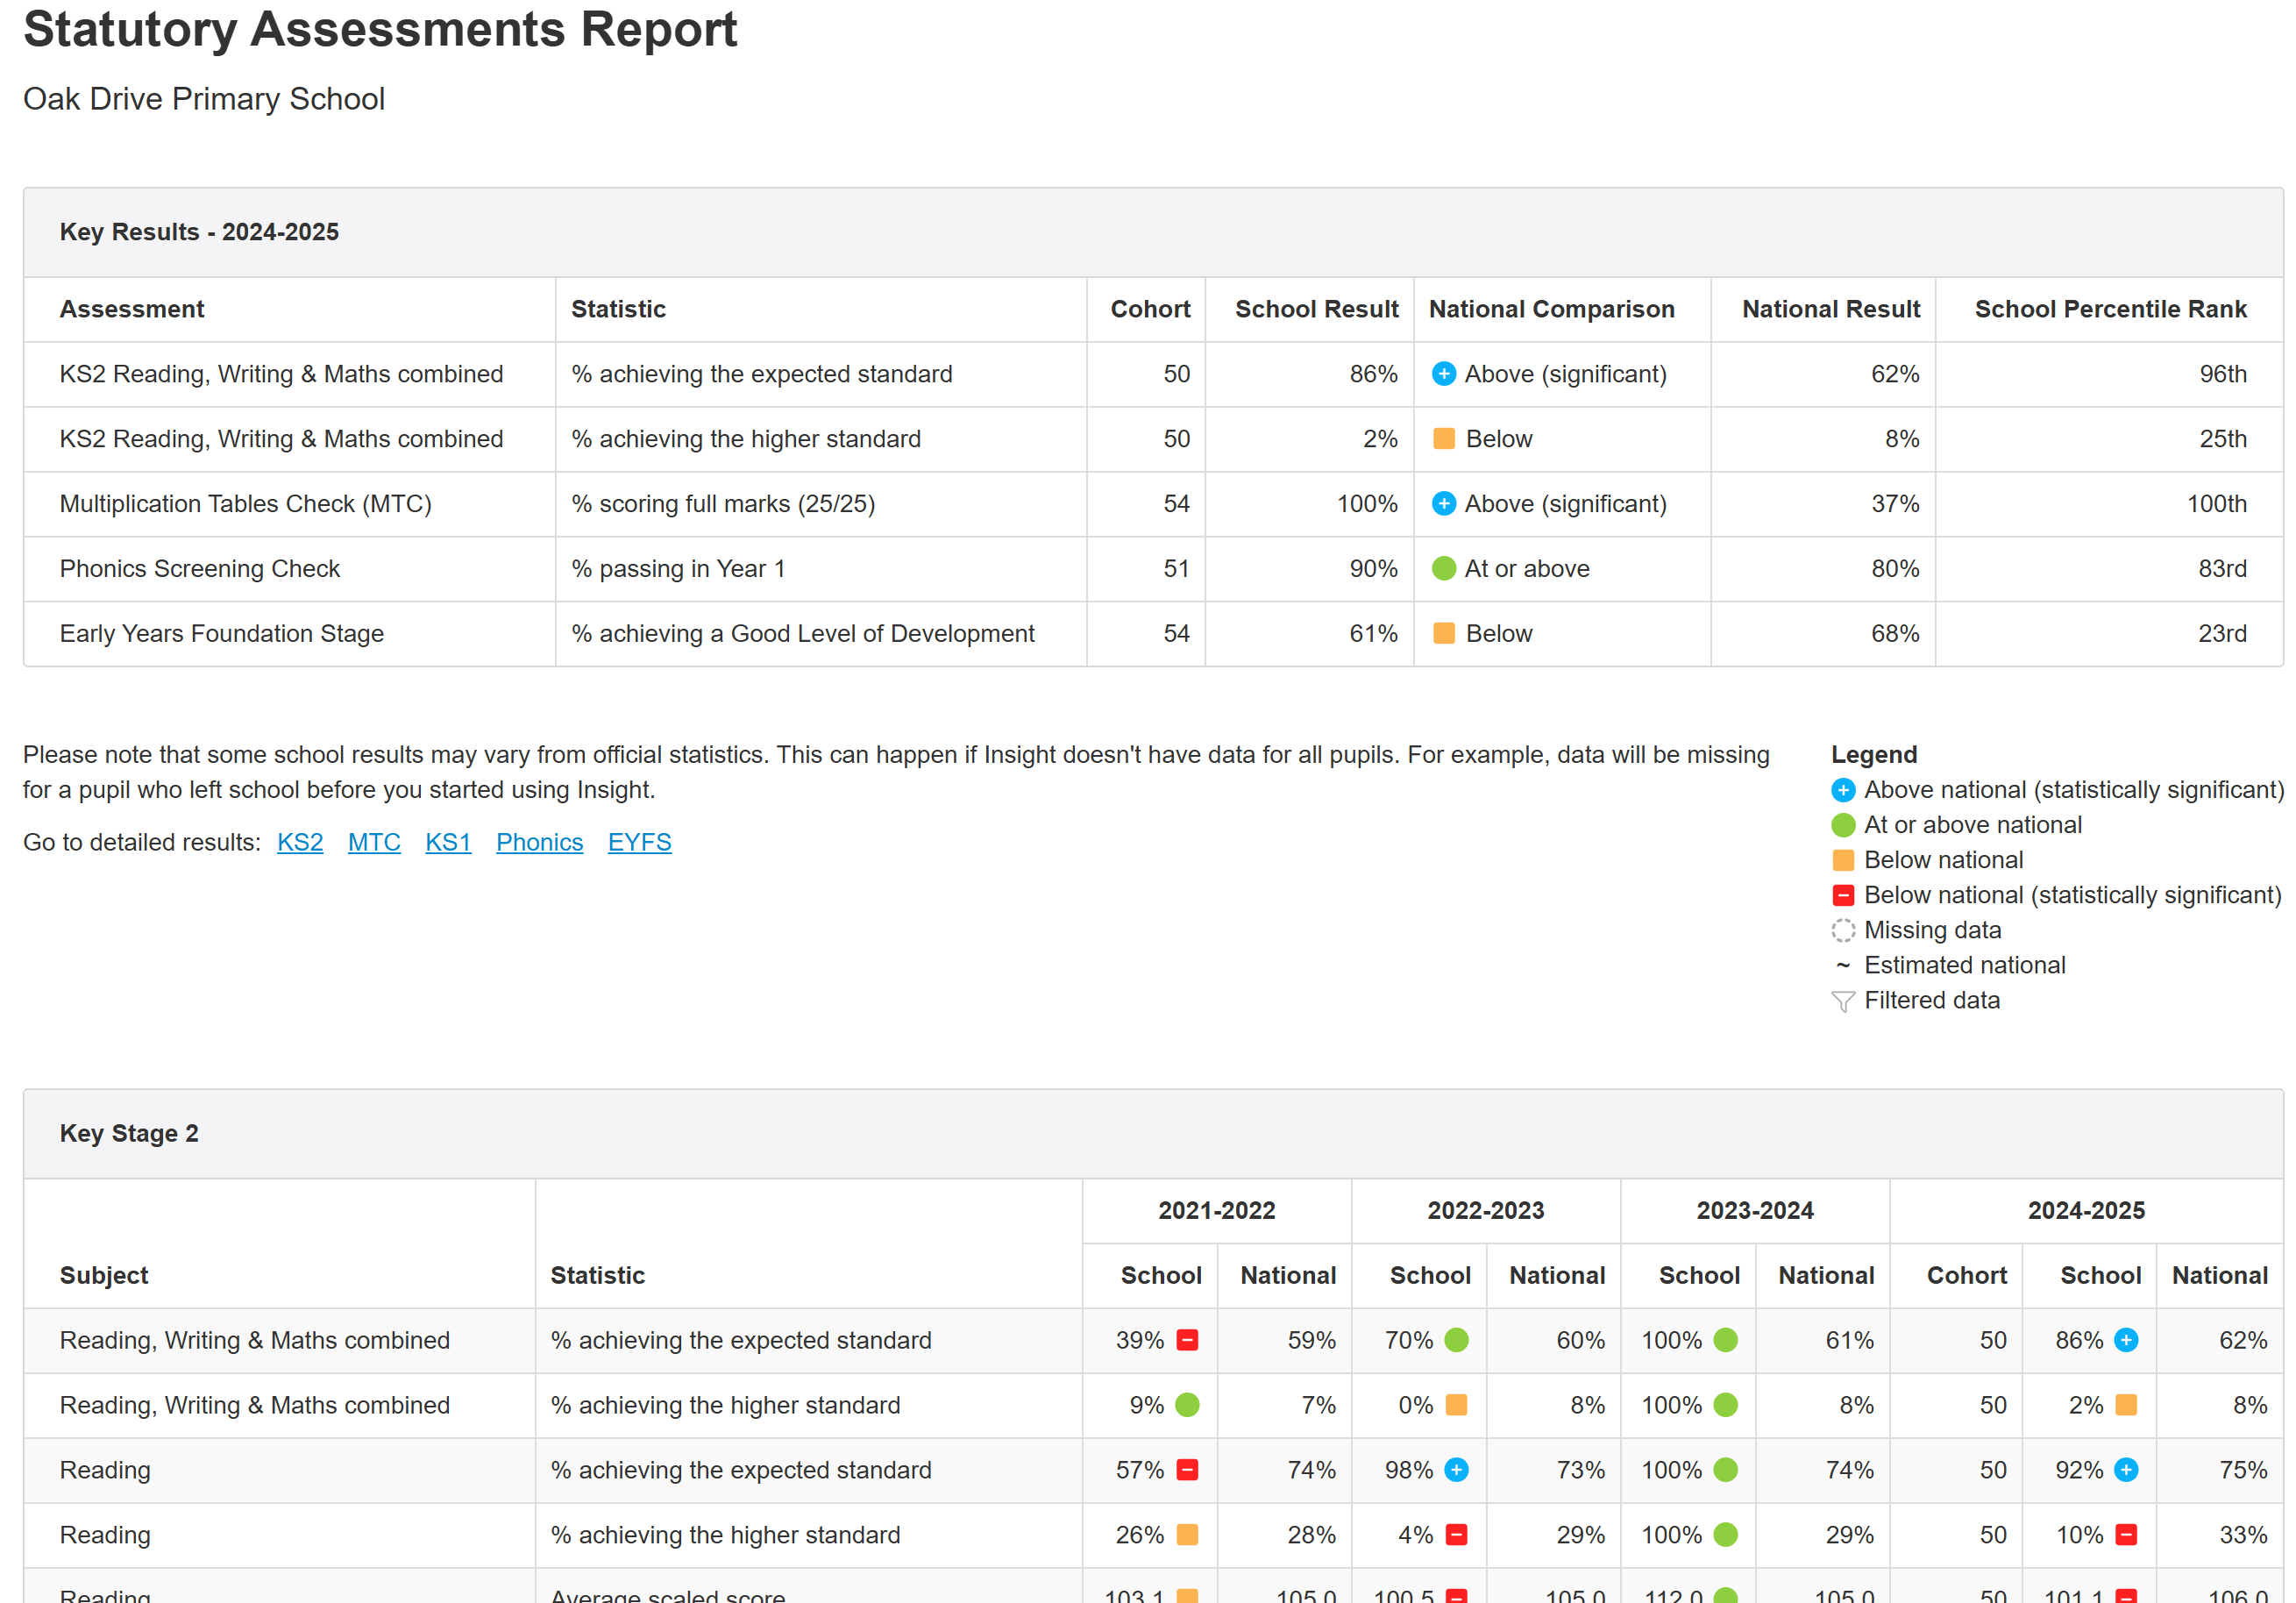
School Results
The School values are calculated using assessments for pupils who were on roll in your school before, or on, the 30th June in the applicable academic year.
This is to try and ensure the values match the ones you see in DfE/Ofsted produced reports, such as ASP or the IDSR.
If you still have some pupils who should be included/excluded, see the later section on ensuring the correct pupils are included for more.
The % values are rounded to the nearest whole number, consistent with the DfE compare schools service and ASP.
Average values are shown to one decimal place.
Adding Missing Data
If you have any data missing, the easiest solution is to import a CTF containing the data. If you don't have the data available, for example in your MIS, you can use the DfE Get Information About Pupils website to obtain it. See this help guide for more details.
It is also possible to manually enter the data via the Enter Data menu.
Overriding values
If you are unable to source any historical pupil statutory assessments for all pupils, it is possible to override the displayed values in the report. This can be done if there is no current value or to override an existing one.
To do so, ensure you have no filter applied and click on the value you want to enter.
In the window listing the pupil names (and any existing results) click Override.
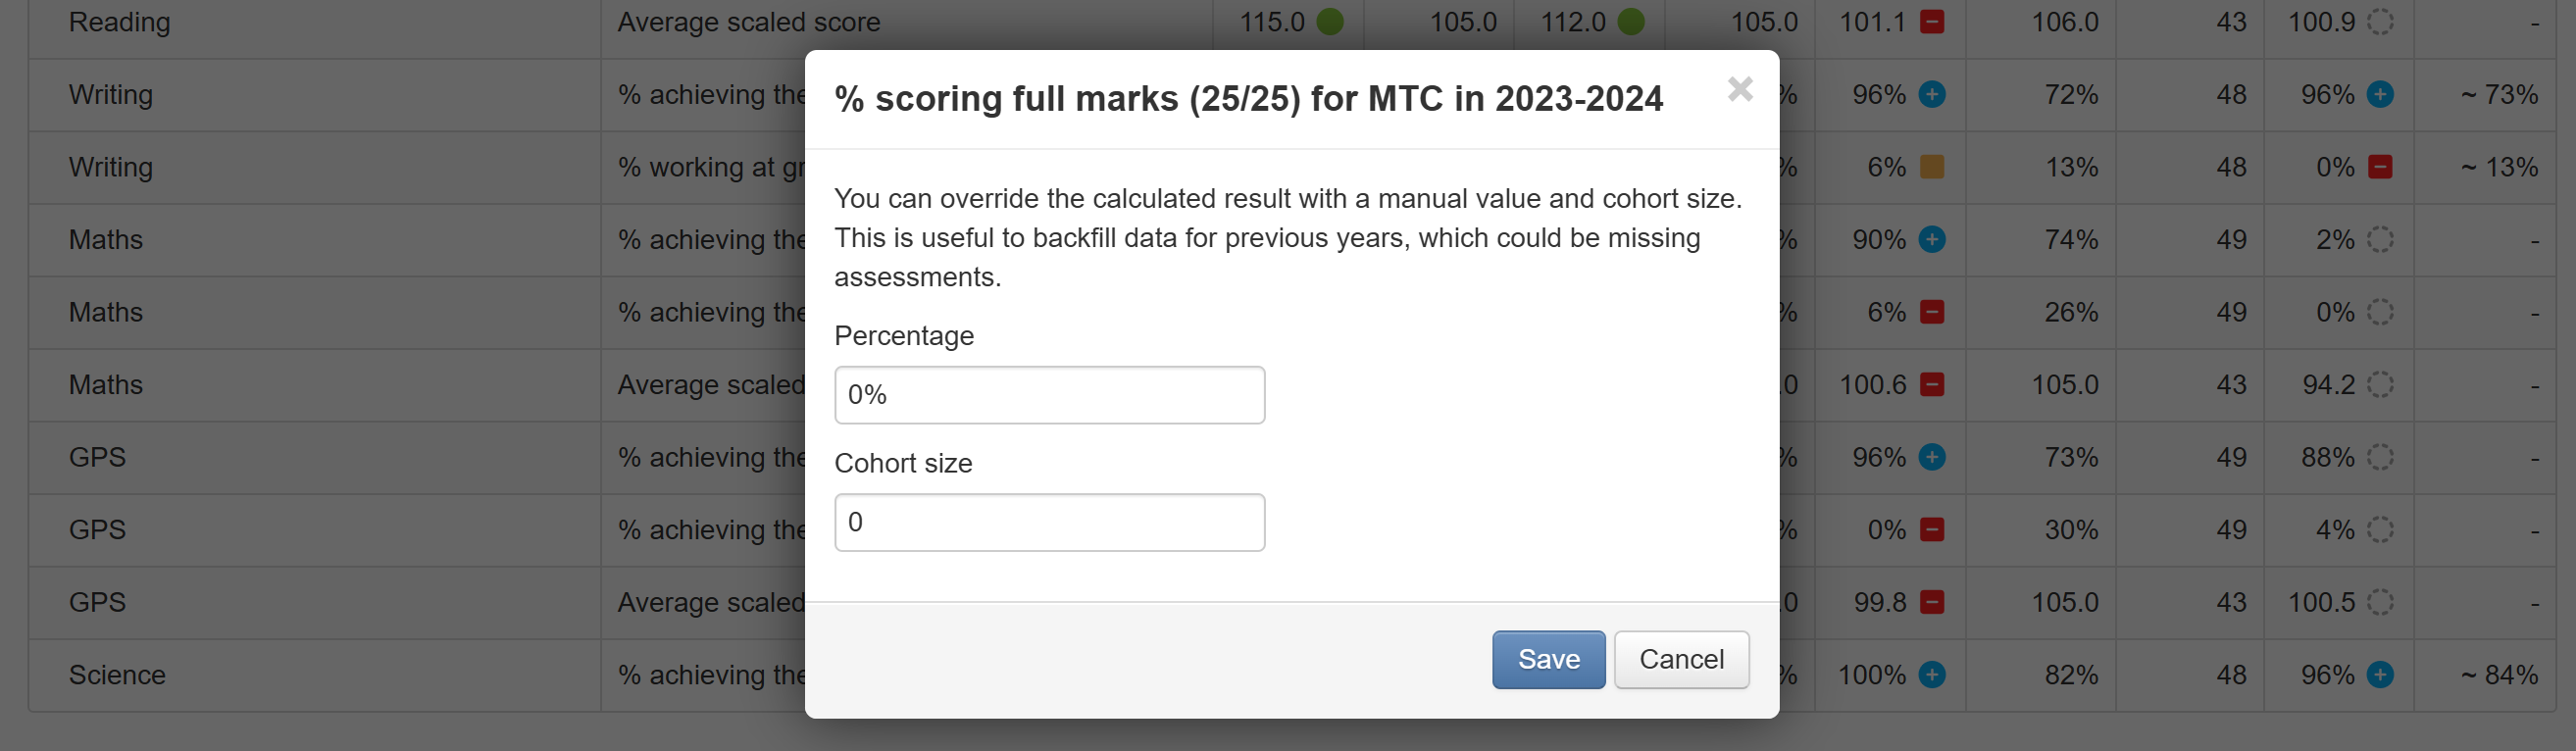
Enter the required values and click Save.
Both the result value and the cohort size are required. The cohort number is used as part of the calculation of whether a result is significantly above or below the national value.
The Statutory Assessments report will now display these new values. If applicable, overridden values will also be used by the Trust version of the Statutory Assessments report.
Overridden values are only used by the Statutory Assessments report and relevant placeholders in parent reports. All other reports in Insight will continue to use individual pupil data.
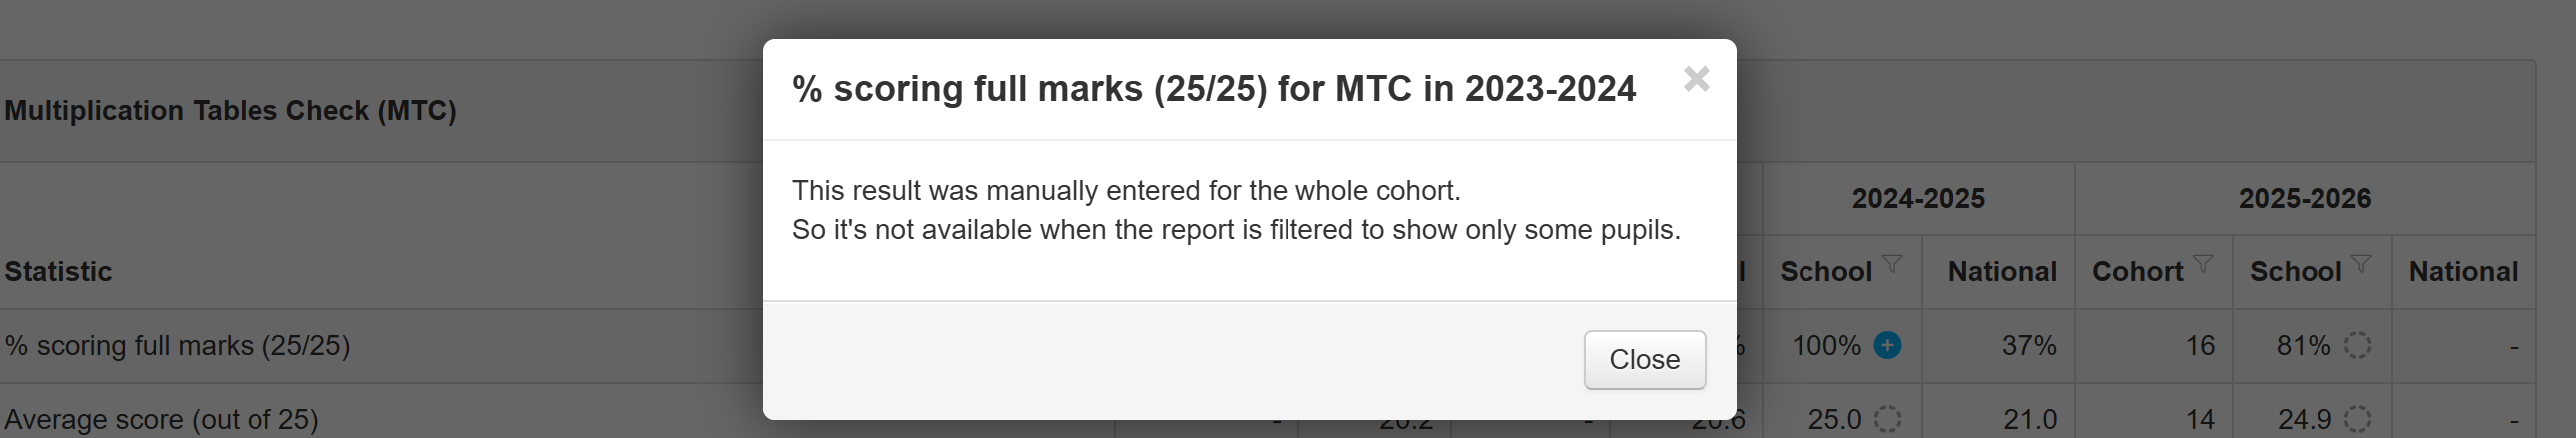
Overridden values only apply at the top, all pupils, level. If you apply a filter this requires the underlying pupil data to calculate so any values that have been overridden will display as grey pencil icons.
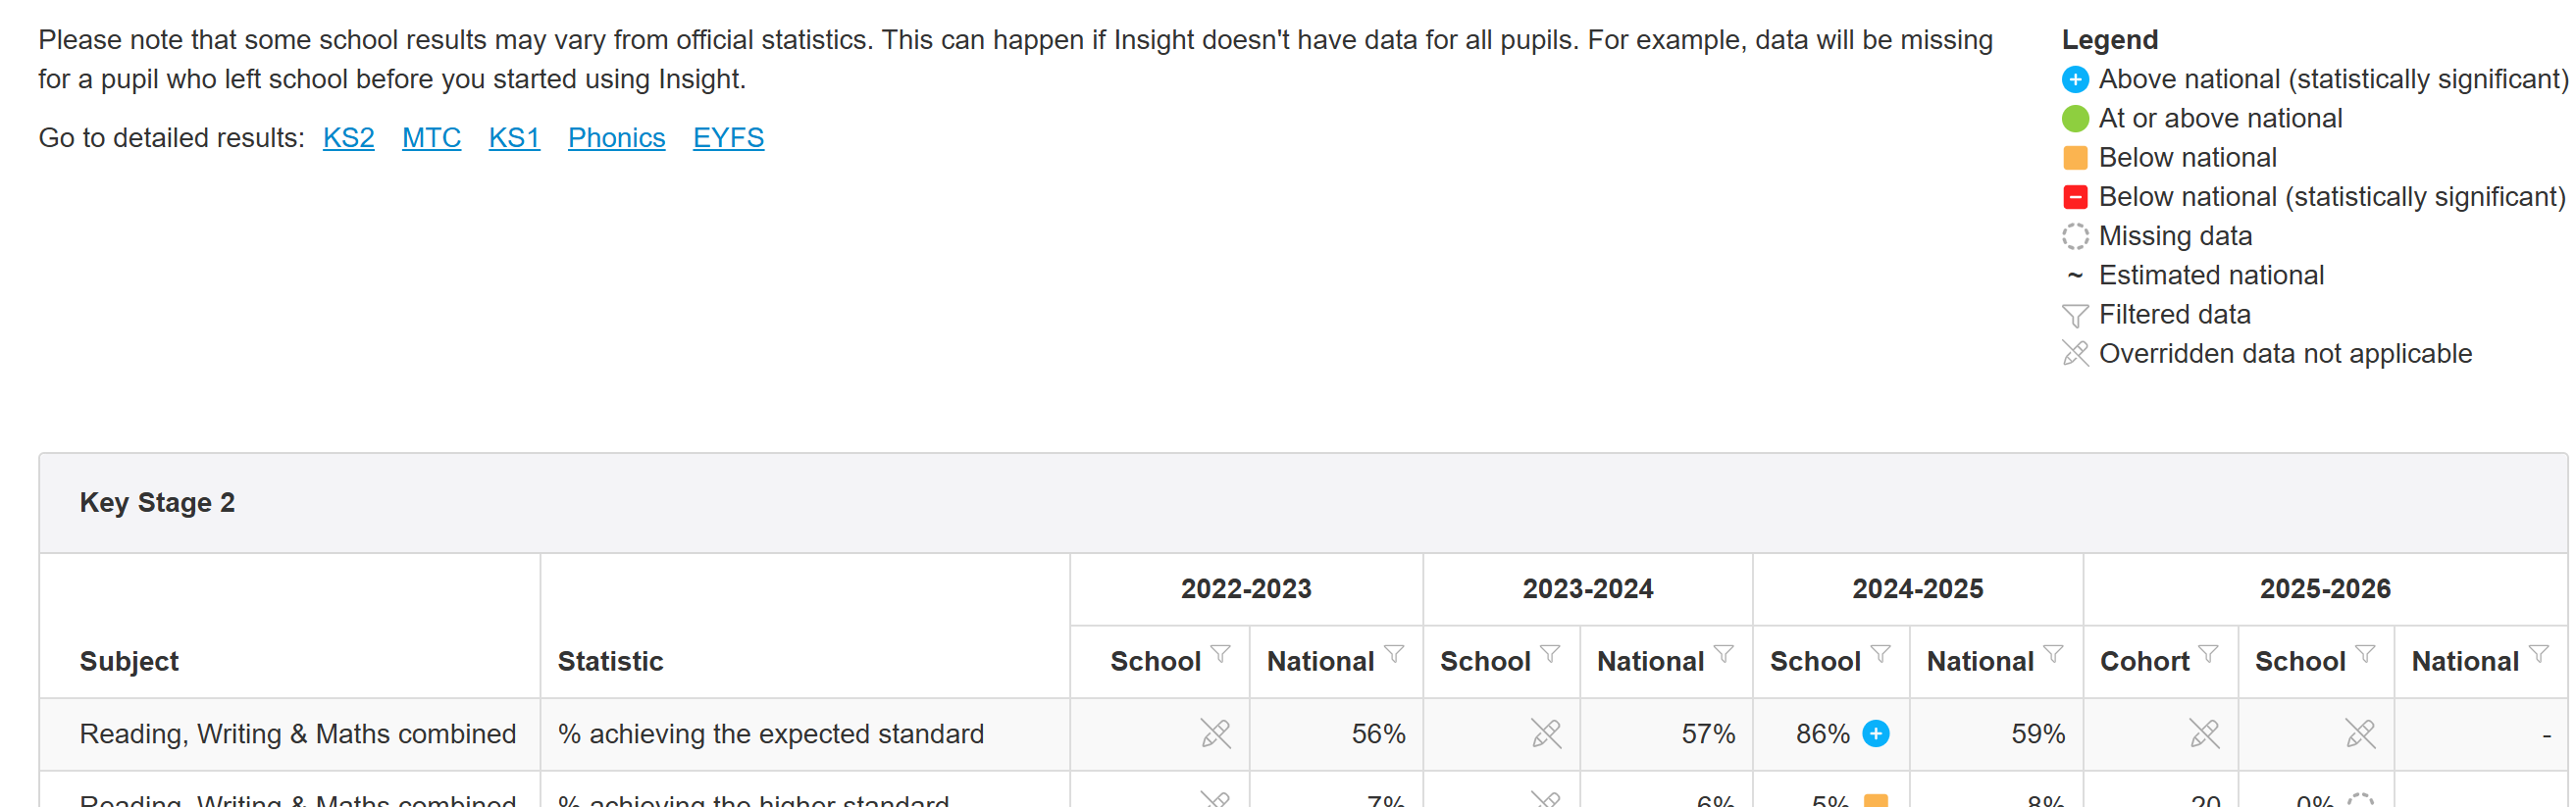
If you click on an overridden value when a filter is applied, a message will explain that it only applies to the whole cohort.
To edit or delete an overridden value, simply click it (when no filter is applied). Then choose Edit or Delete Override as required.
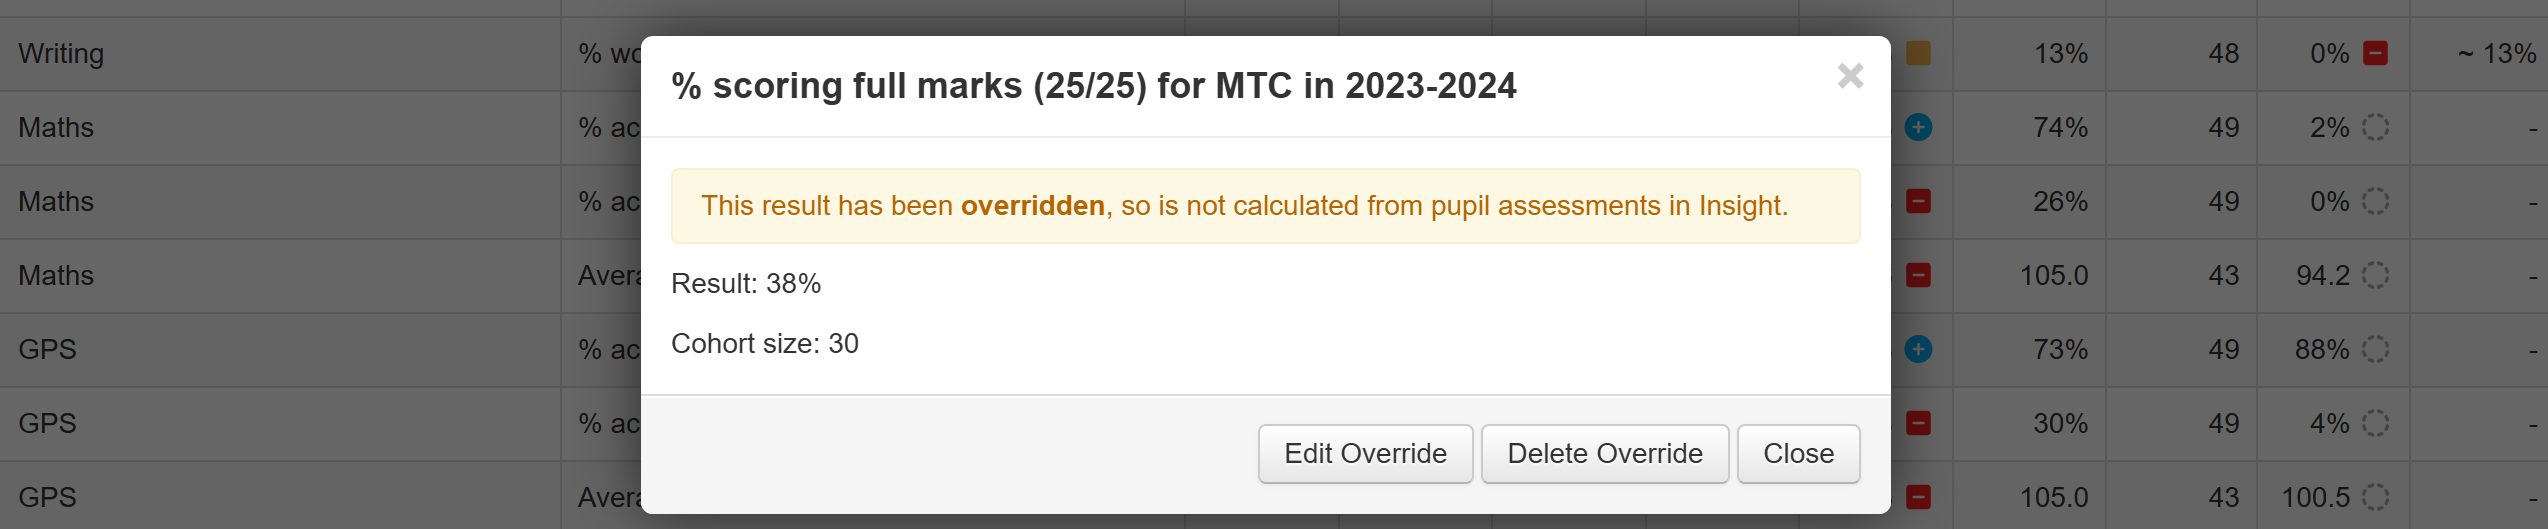
Deleting the override can be useful if you subsequently add any missing pupil data and want to use filters.
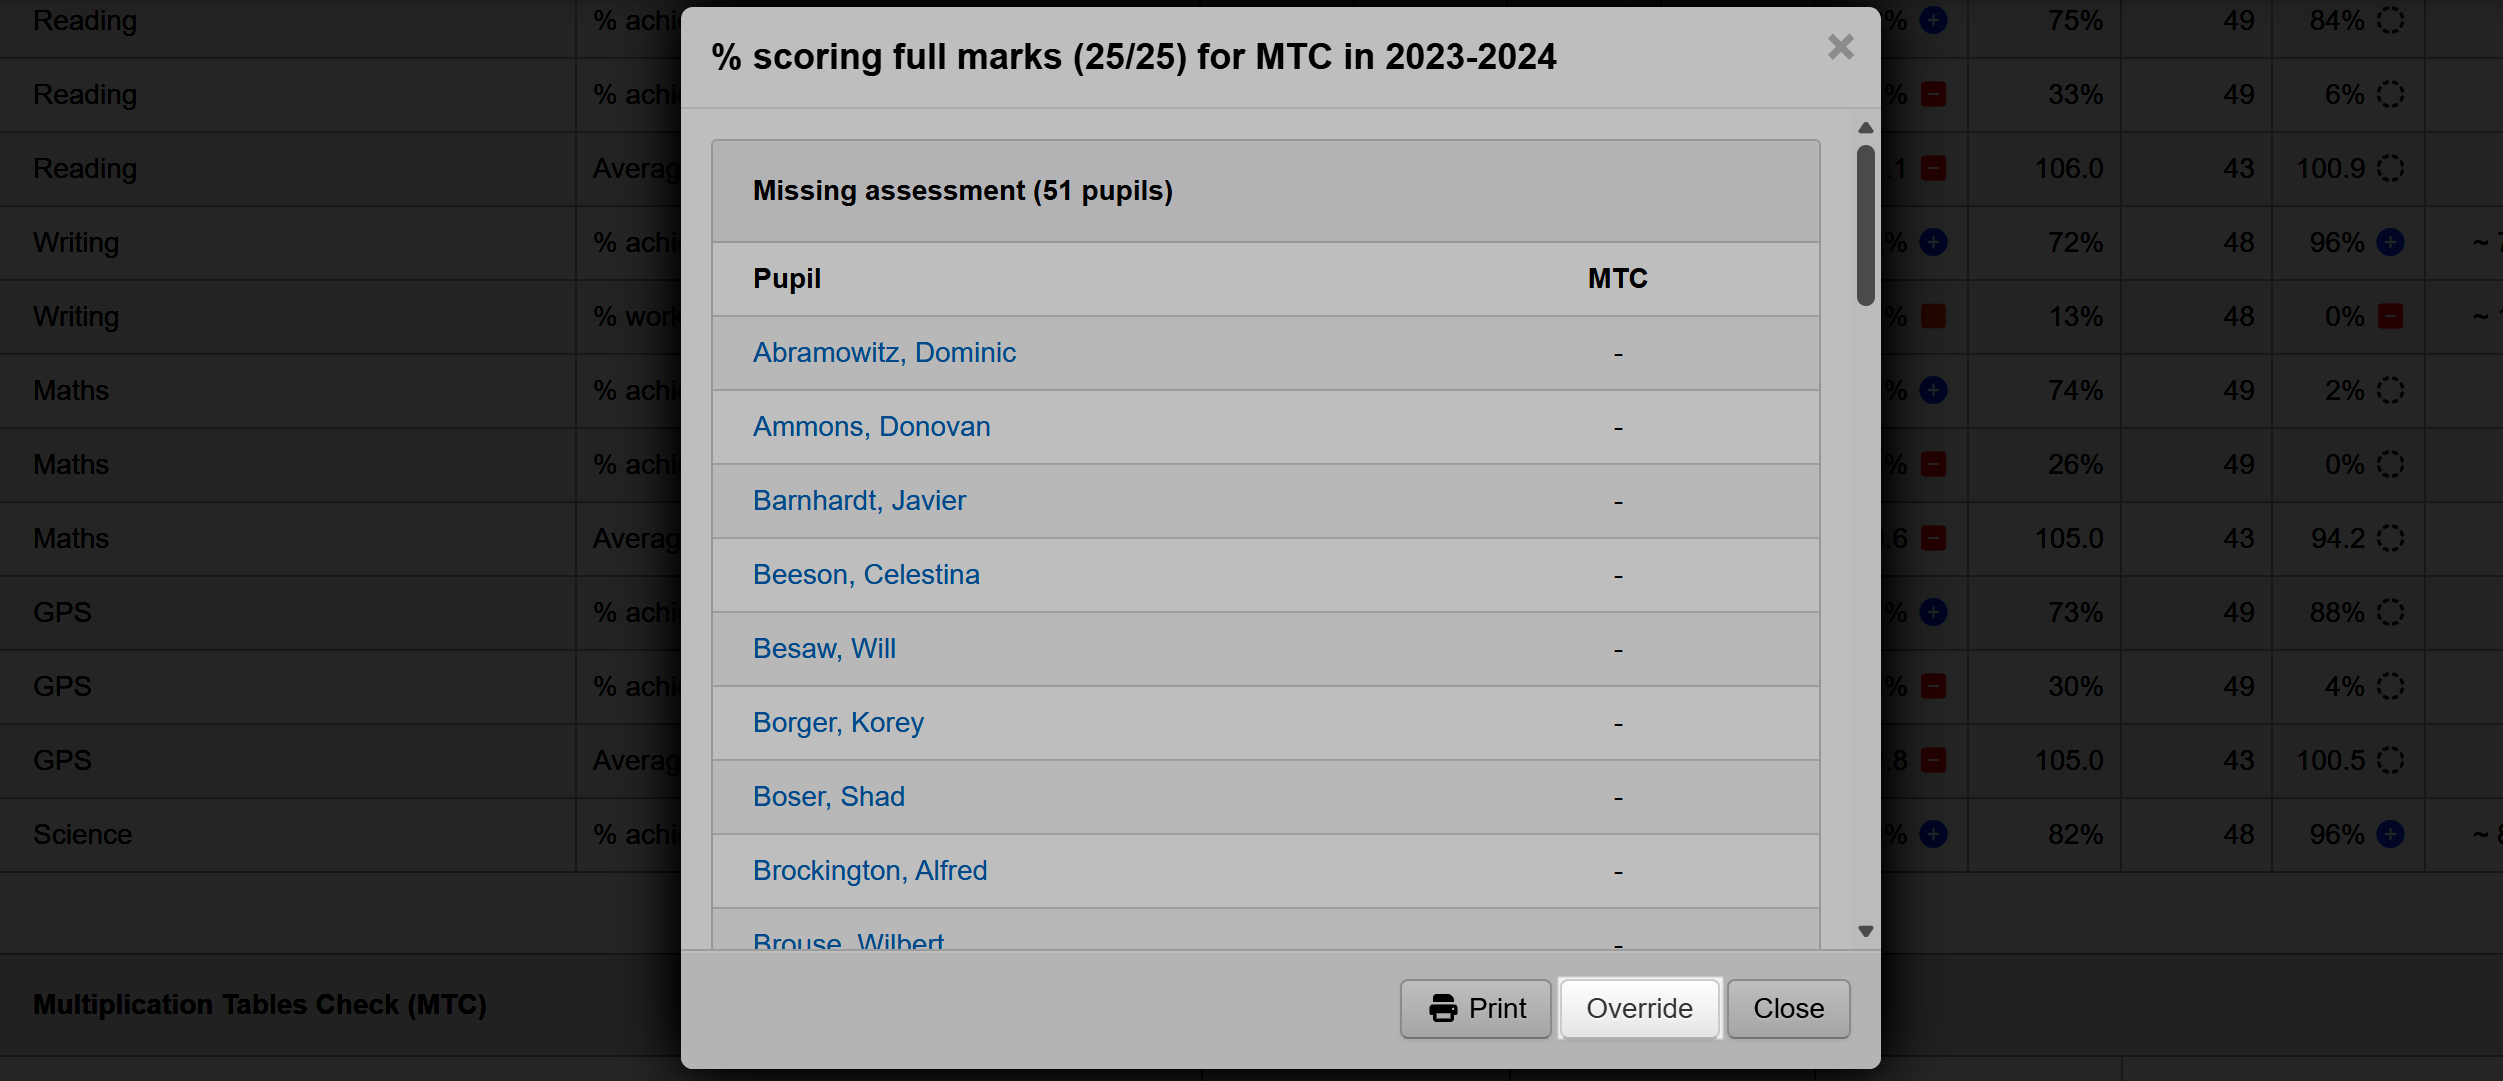
Viewing individual pupil data
It can be useful to see precisely which pupils, and which assessments, make up the aggregate figures.
To do so, click on any of the School Result or Percentage figure.
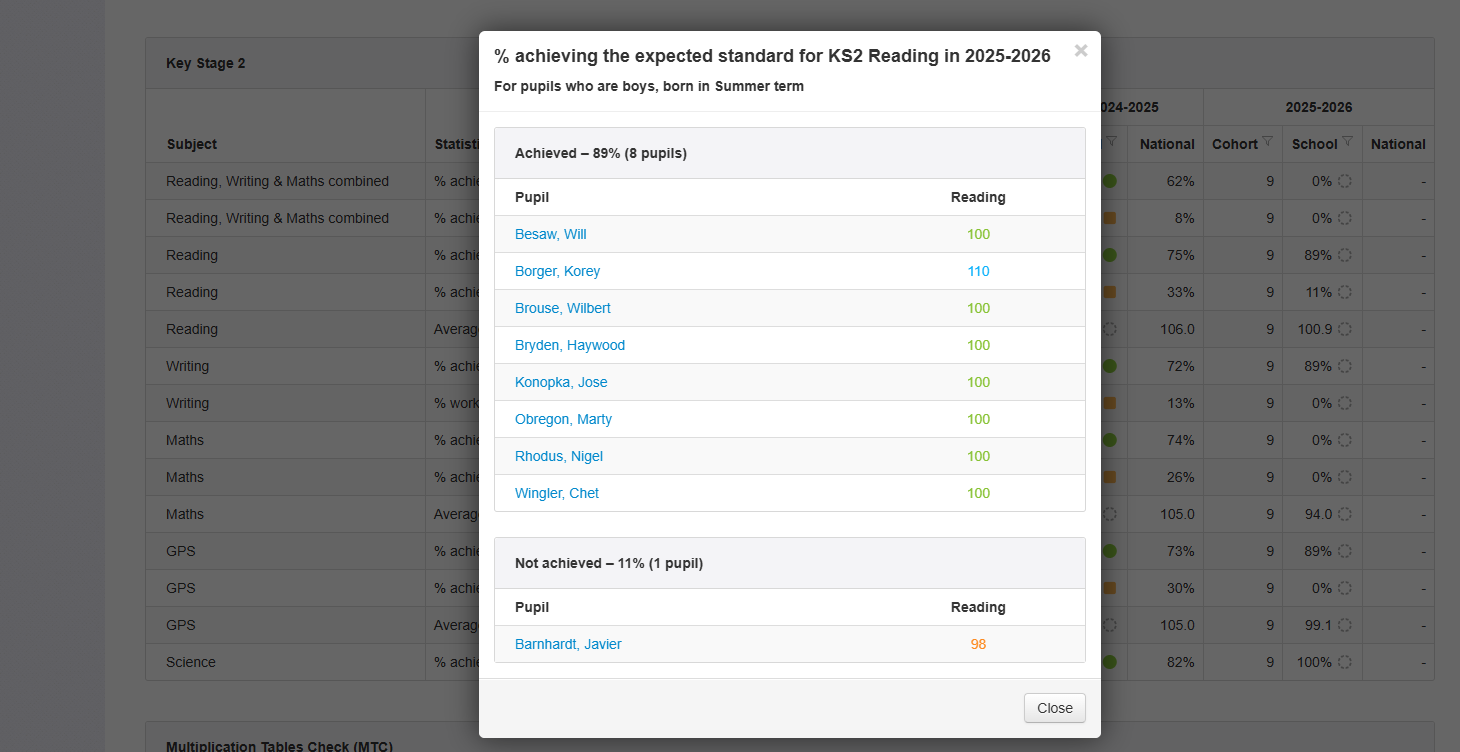
A breakdown of the pupils and their assessments will then be displayed. Any applied filter will be retained.
Report display options and Settings
By default, the report shows the previous four years. On the 1st June, it automatically rolls over to display the current year (and the previous three, ignoring years in which Covid restrictions caused schools to be closed). The report will always show four academic years of data, not a single year.
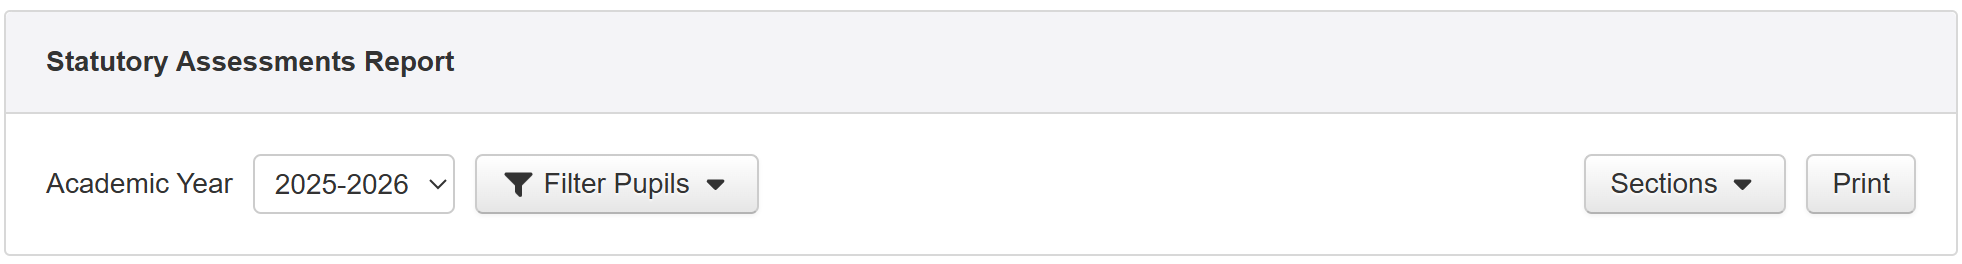
The Academic Year selection, in the top left, allows you to action this rollover sooner, as you may already have your latest data in place. You can also choose to alter the latest year shown with this selection.
The data displayed is governed by the range of year groups in your school. For example, Infant settings will see data for EYFSP, Phonics screening and KS1.
When viewing the report, you may want to alter the sections on display. For example, to only view assessments in Key Stage 2 or to remove the, now optional, Key Stage 1 Statutory Assessments. To toggle sections on and off, click the Settings button and make your selection.
If you want to jump to a section quickly, click the appropriate hyperlink beneath the Key Results table.

Filtering the report
The Statutory Assessments report includes the standard Filter Pupils menu. It is not possible to Group Pupils.
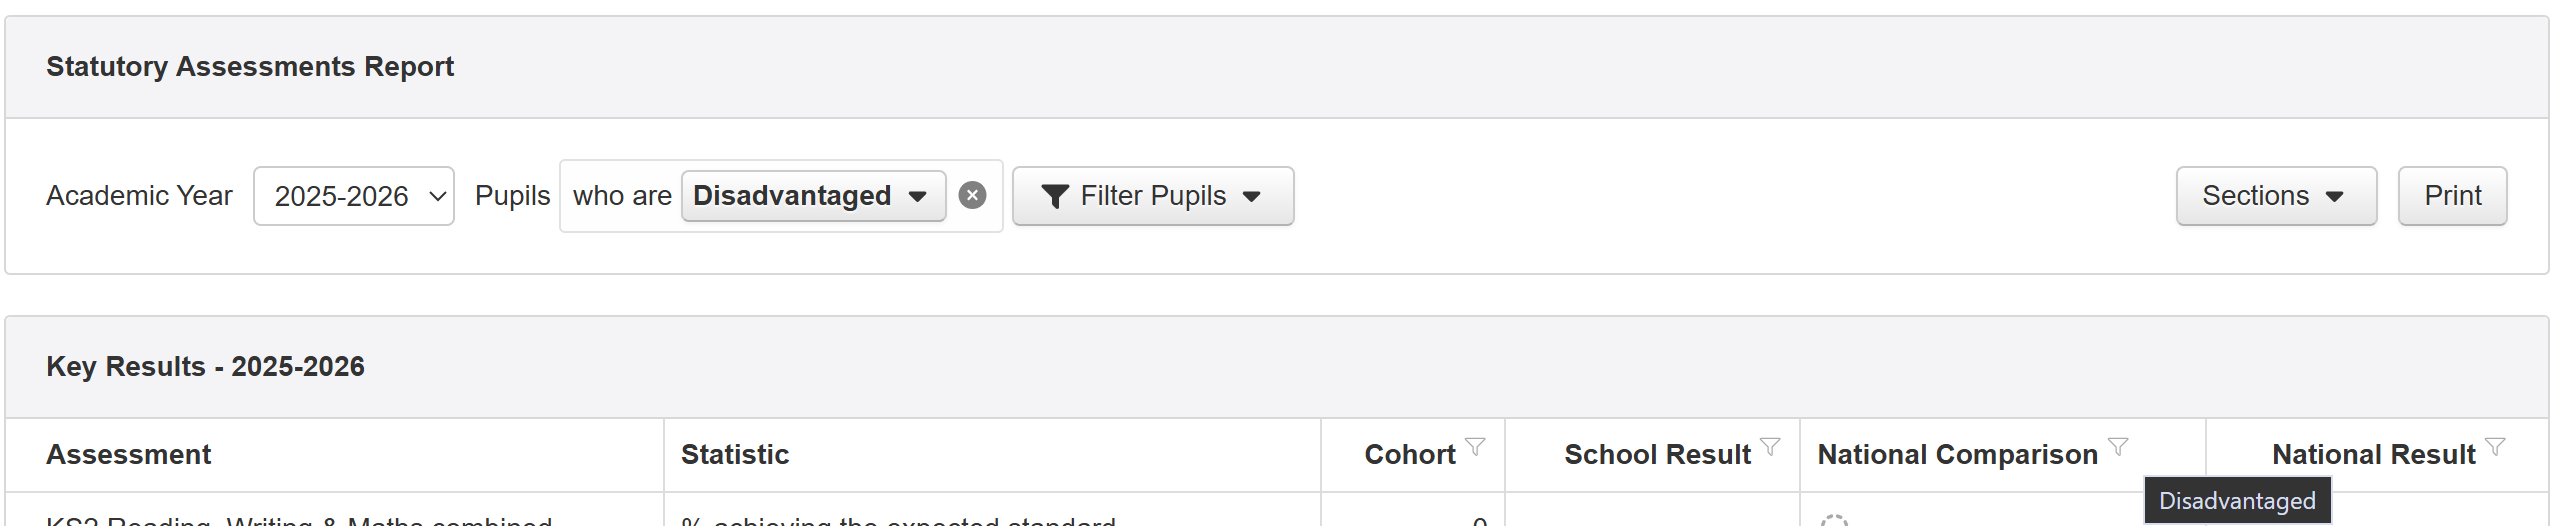
When a filter is applied, a small filter icon will appear in the appropriate column headers. Hovering the mouse pointer over the filter icon will display a tooltip showing the filter that has been applied. This can be useful if you've scrolled down the page.
National Comparison
Where a national figure and a school result are present, Insight will offer a national comparison as follows:
National Data Sources
National figures come from the government's Explore our statistics and data website, for example the KS2 headlines page.
National figures are shown in the National (result) columns.
National data for filtered groups
When you apply certain filters, Insight will display the national pupil characteristic comparison data to match that filter. These are included as they are made available by the DfE so may not yet be available for the most recent statutory assessments.
If a national pupil characteristic filter comparison is not available, there will be no value shown for national. Exceptions to this are filters that have no impact on the pupil demographics, such as date-based filters.
The national pupil characteristic groups in Insight are for the following groups:
- Gender
- Disadvantaged
- FSM
- SEN (including with/without EHCP)
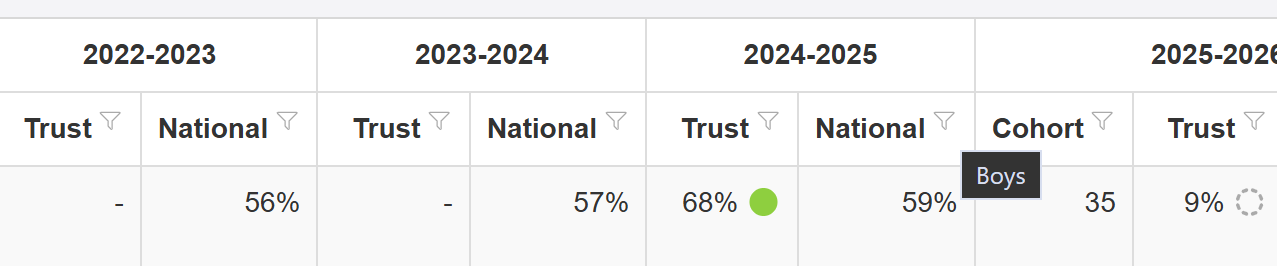
When a national value is a filtered pupil characteristic one, the filter icon will be displayed in the National header. Hovering the mouse over it will display a tooltip detailing what the national comparison is. e.g. Boys
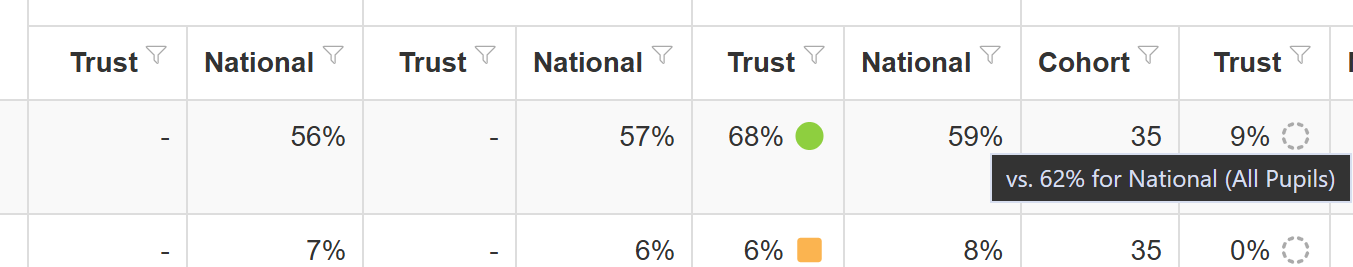
If you hover the mouse over the filtered national result, a tooltip showing the all pupils national will be displayed. This can be useful as you don't have to remove the applied filter to see what the overall national comparison is.
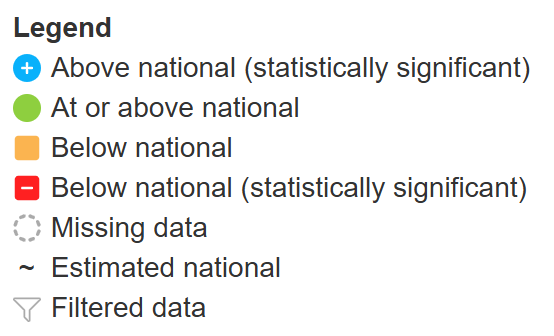
Insight Estimated National
During the period when you have entered your results, but the official national figures are yet to be released (which can be several months in many cases) Insight calculates values based on the data held for all Insight subscribing schools. These are automatically updated as sample sizes increase, and are replaced with official figures when they are released (see Statutory Tests: National Statistics Results & Statistics Schedules).
These estimated values are for all pupils only, not any filtered groups.
An estimated value is indicated with a ~ symbol before it.
For more information on sample sizes and accuracy, please see Insight Estimates for National Results.
During the period when there is no official national figure nor a large enough sample to calculate an Insight estimate, a dash (-) is displayed in the National cell.
When a filter is applied, no national data is shown.
At or Above or Below National
At or above national and Below national are a straightforward comparison and take no account of any statistical significance methodology such as cohort size. They are presented to enable you to identify any areas that merit further investigation and possibly identify trends. With smaller cohorts, direct comparisons should be treated with caution and, for this reason, the cohort size is displayed for the most recent data. To see the cohort size for older data, simply click the school value concerned.
Statistically Significant
There are also indicators for above and below that represent statistical significance. These comparisons use statistical methods to show when differences in a school's performance may be due to more than chance variation.
For percentage values, these comparisons use the same calculation methodology as the Ofsted IDSR 'Achievement in phonics and at key stage 2' section. Values marked as Sig + or Sig - in the IDSR should also be marked as statistically significant in the Statutory Assessments report.
For average scores this is the same methodology as used by the DfE for progress results, documented in Primary School accountability in 2025: technical guide, Confidence intervals.
Missing Data
When missing data prevents a comparison being made, the following icon is shown.

The missing data can be any of: school value, school cohort, national value, Insight estimated national value, or for average scores the standard deviation of the national/Insight estimated national scores.
School Percentile Rank
The Key Results table, at the top of the report, includes a column for School Percentile Rank.
This is calculated based on the school result, compared to all Insight subscribing schools.
The value is the percentage of results in the frequency distribution that are lower than the school result. So a higher percentile rank may be considered to be better than a lower one. Of course, the percentile rank does not take any other factors into consideration, such as prior results or intake, so should not be used in isolation.
Ensuring the correct pupils are included
Occasionally, you may have pupils joining or leaving school around the dates of the statutory assessments. Insight uses the 30th June as an "on roll check" for inclusion in this report (apart from non-statutory KS1 which remains as 31st May). This means that any pupil who has statutory assessments and leaves after the 30th June will still be included in the report by default.
If you have a pupil who joins school after that date, but should be included for any of the assessments; or a pupil who joins before, but should not be included, you can use the Assessed On date against their statutory assessments to override the 30th June default.
If a pupil is on role on the assessed on date, that assessment will be included in the report.
We'll take the example of EYFSP here, and assume all the assessments have already been recorded. Let's say that a pupil joined the school on the 1st July and should have their EYFSP assessments included in the report.
Firstly, it may be easier to apply a pupil filter so you can see the pupil to change their assessed on date.
To add an Assessed on date for EYFSP ELGs, choose the Enter Data menu followed by Statutory Assessments. Choose EYFS Profile.
On the next screen, it may be useful to filter only to the specific pupil(s) concerned.
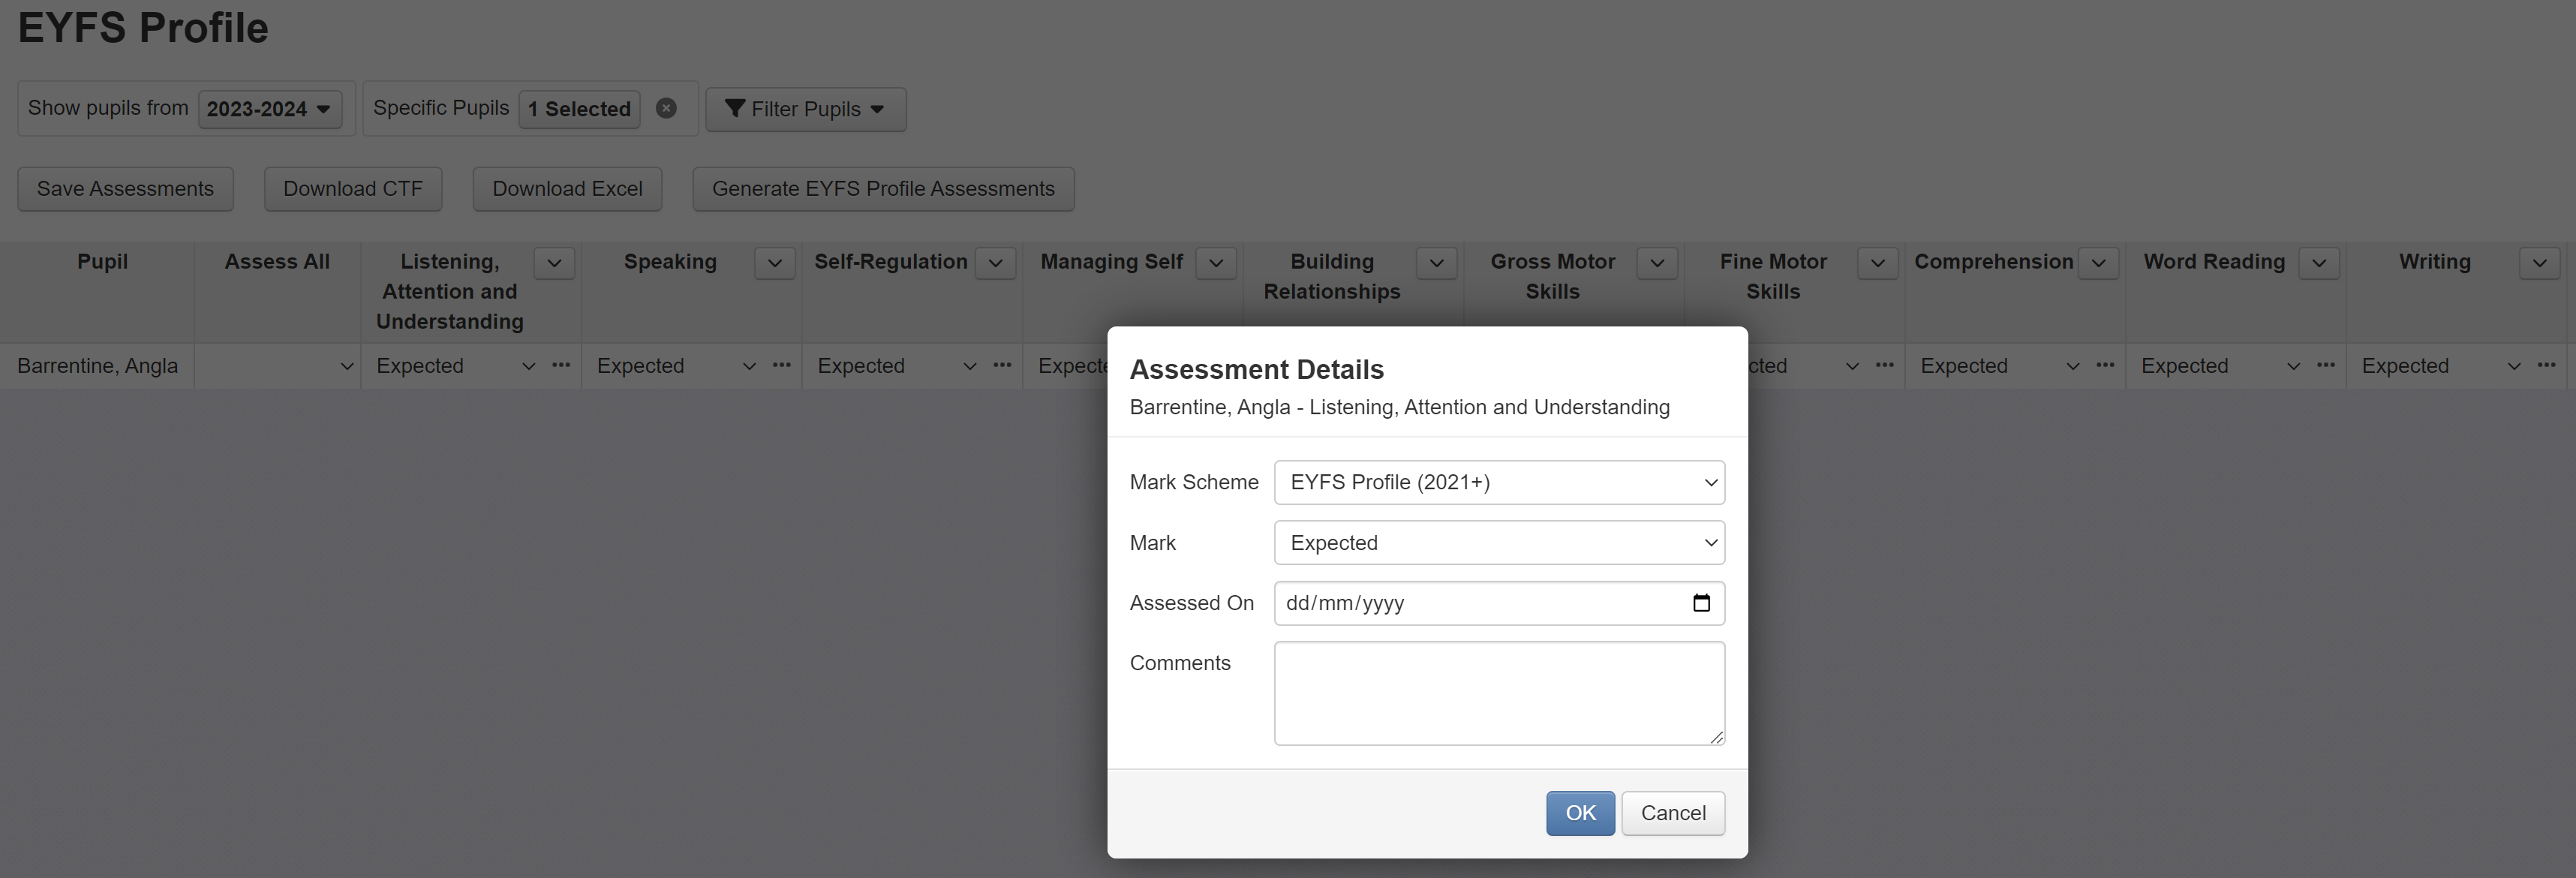
For EYFSP you will need to enter Assessed On dates for each ELG.
To do so, click the three dots next to each assessment. In the window that appears, add the appropriate Assessed On date. For our example, that is the 1st July in the current year.
Once the date is entered for all the ELGs ensure you Save Assessments. This pupil will now be included in the Statutory Assessments report.
The same approach will work for other statutory assessments.
For example, you can set the Assessed On date to ensure a pupil who joins the school just after you administer assessments, but before the end of term, is not included. Any imported assessments from the previous school can be given an Assessed On date of before the pupil's Start Date. So they'd be excluded from the Statutory Assessments report.
For MTC and KS2 Scaled Scores, these are usually imported but you can amend them, and add Assessed On dates, by going through Enter Data > School Assessments.
Multi-Academy Trusts
Please see our supplementary guide Statutory Assessments Report for Trusts for more information on the Trust verison of this report.