Statutory Assessments Report for Trusts
 Updated
This guide adds additional detail for the Trust version of the Statutory Assessments report and assumes understanding of the content detailed in the school statutory assessments report guide.
Viewing Statutory Assessment data for the Trust
The statutory assessments report for Trusts functions in the same way as the School version.
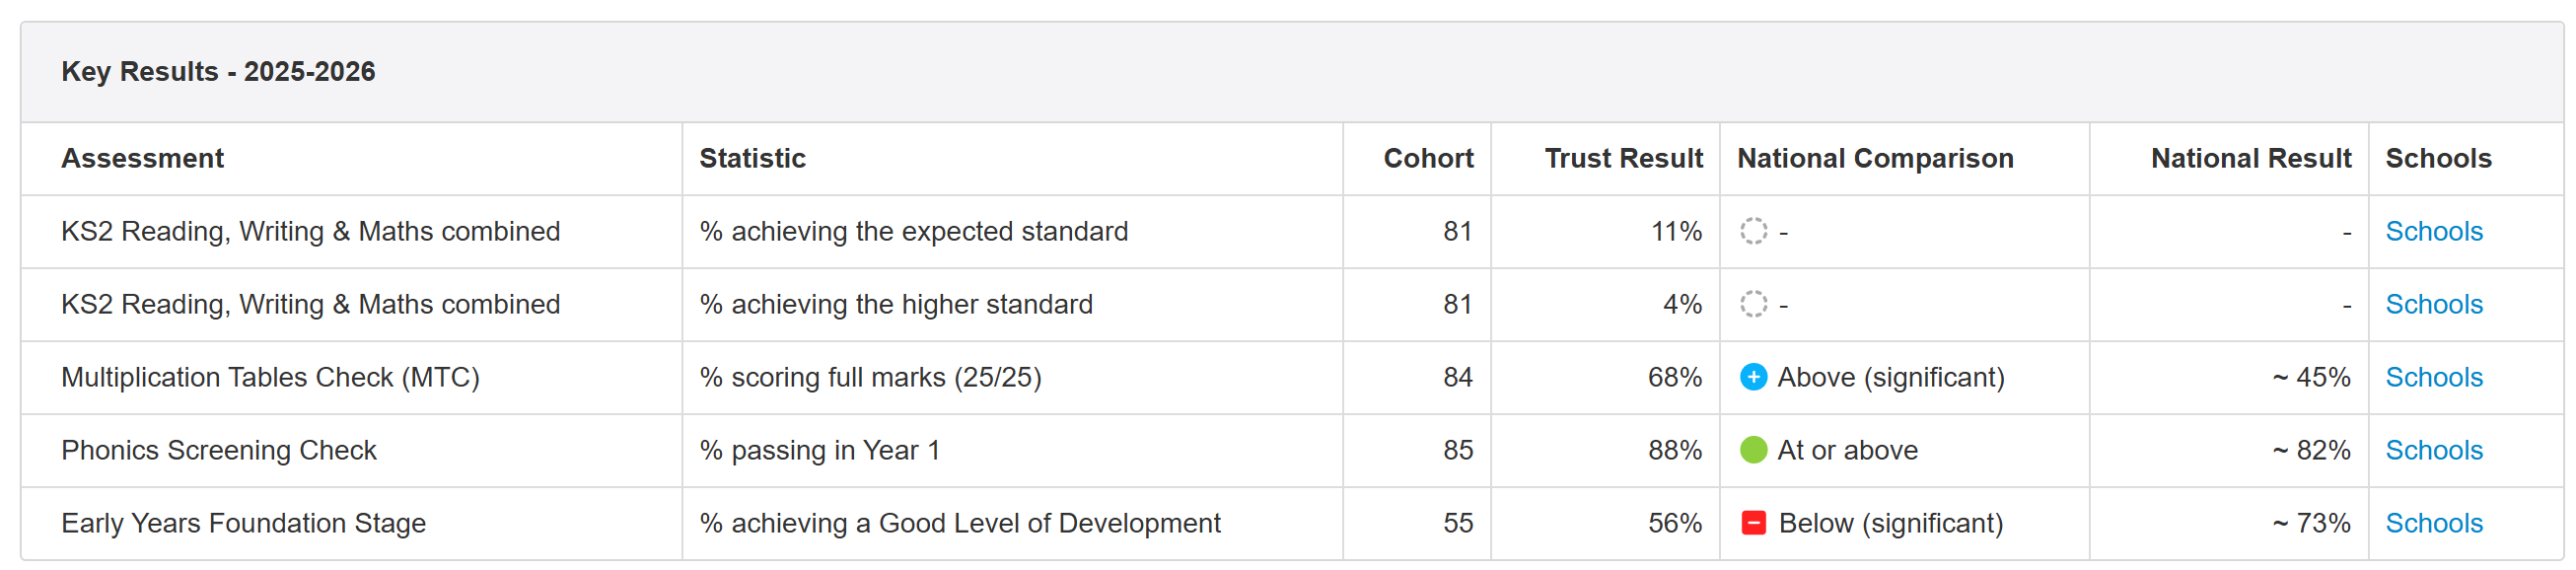
Overall Trust Results
The Cohort number is the sum of all the included pupils across all schools in the Trust.
The Trust Result is calculated using the individual pupil results for all pupils in the Trust; effectively treating the Trust as a single entity. This ensures that, for example, any smaller schools in the Trust do not have a larger weighting on the overall Trust results. This approach also matches the DfE methodology for calculating whole Trust statistics.
Schools are included in the data regardless of how long they have been part of the MAT. This is in keeping with the national published DfE data on "Explore Education Statistics" but differs to the DfE MAT level performance table data which only reports on academies that have been part of the MAT for at least 3 years.
National Comparison
This is the same national value as used for the school version of the report, including any Insight Estimated National Indicator values.
While the DfE do produce MAT level statistics (and prior statistics), these have gaps (no data for 2021-2022) and do not include some statutory assessments (e.g. EYFS, Phonics & MTC).
The Values are also very close to the standard national ones.
Filtering the report
The Trust version of the Statutory Assessments report supports filters.
As the report can take a little while to calculate during busy times you are able to choose your filter then click Load Report to begin calculating.
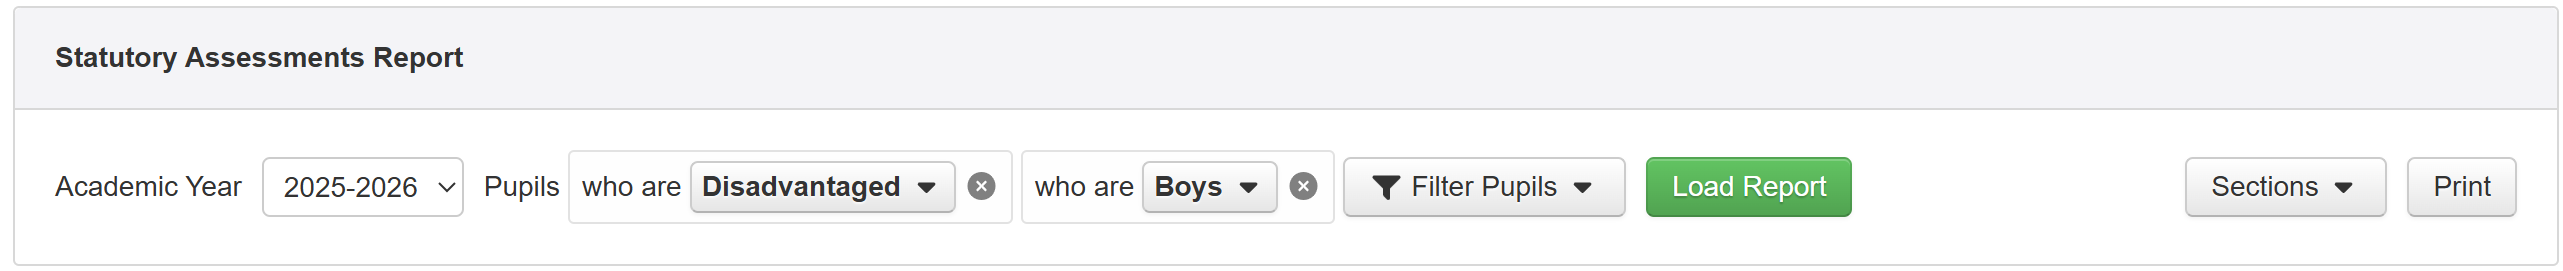
This is particularly useful for combined filters as you can select each component then Load Report.
Viewing Statutory Assessment data for schools within the Trust
Each row has a Schools link on the right of the table.
Click this to view the individual data for each school in the Trust.
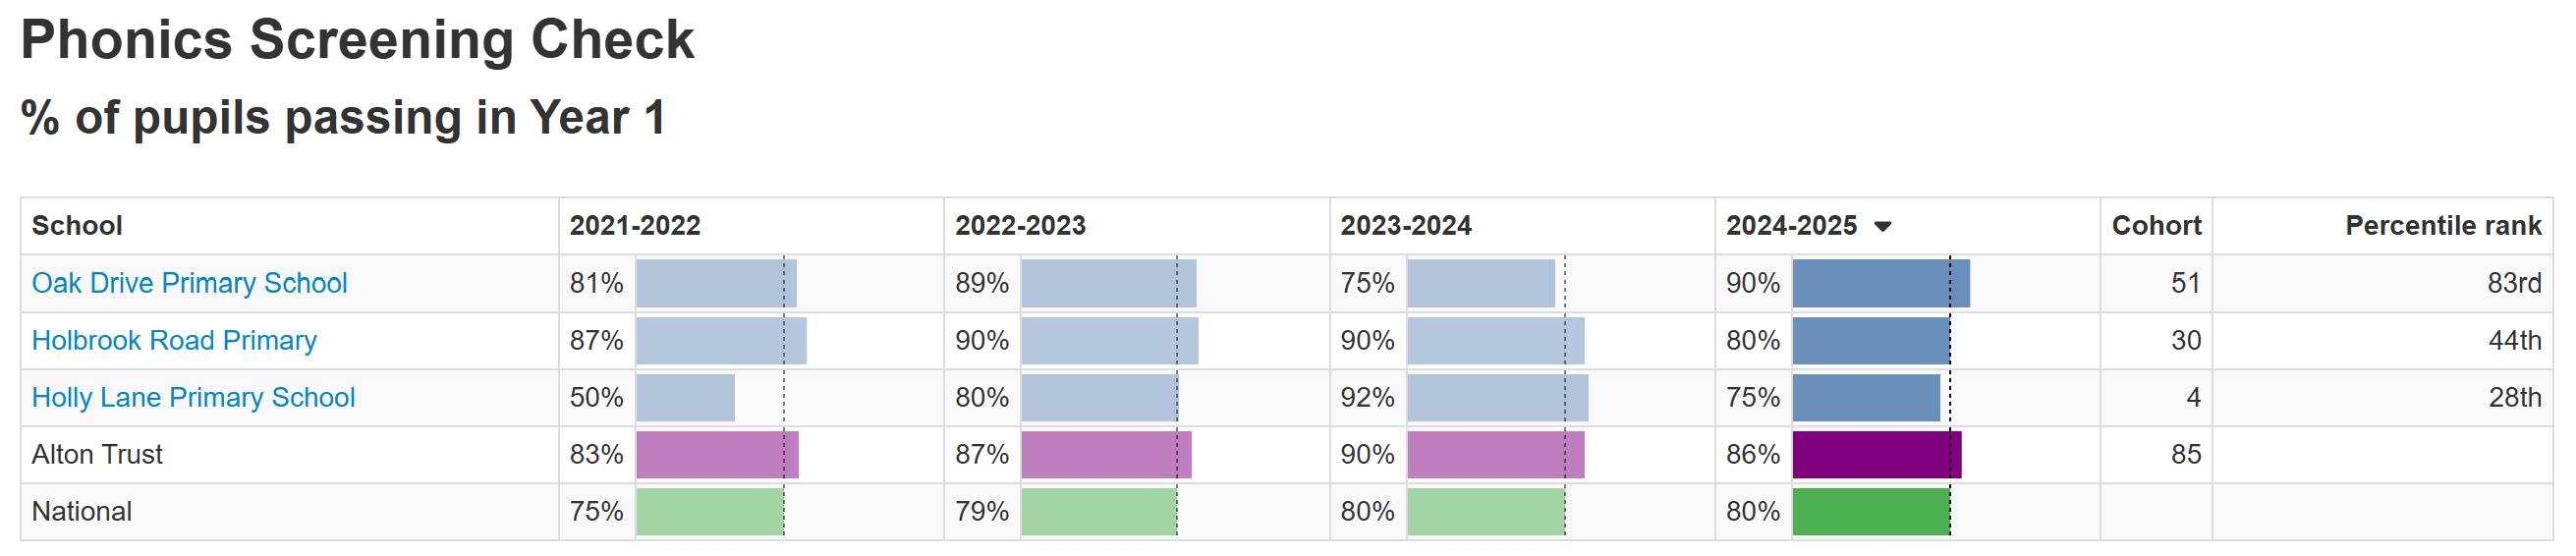
For each displayed academic year, the value for each school is displayed along with the overall Trust and National values for comparison.
Clicking the Cohort number value will show the individual pupil results along with the pupil names.
To aid comparison, a dotted line follows the national value over each bar chart.
All the columns are sortable, so to order schools by their results in a particular year simply click the column header to toggle the sort ascending/descending. To sort alphabetically by school name, click the School column.
If you have applied a filter, this will be reflected in the Schools page.