Setting the rate of 'expected progress' in reports
 Updated
When using progress overviews, progress columns in tables, and the progress elements of headlines reports - aside from selecting start and end points, subjects, and assessments - you are required to set a rate of expected progress. This can cause confusion because it depends on the types of data - the mark schemes - involved. In this help guide we will explore how the various mark schemes influence the rate of expected progress you need to enter into the box when setting up reports.
Where is the 'expected progress' box located?
As mentioned above, there are three types of reports that require you to enter a rate of 'expected progress'.
1) Progress overviews
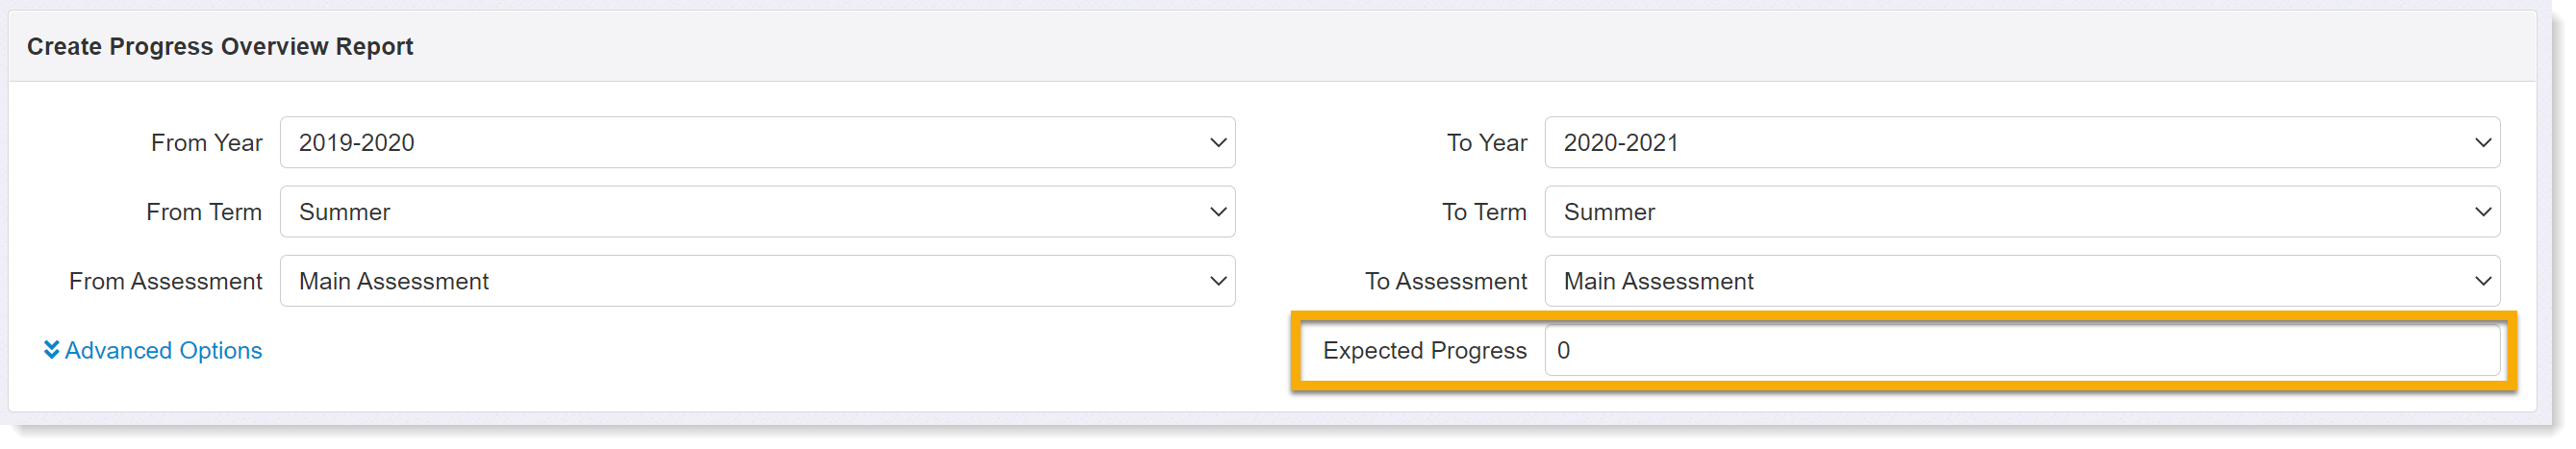
In the progress overview, the Expected Progress box is found on the right-hand side of the settings, below the endpoint selection menus.
2) Tables
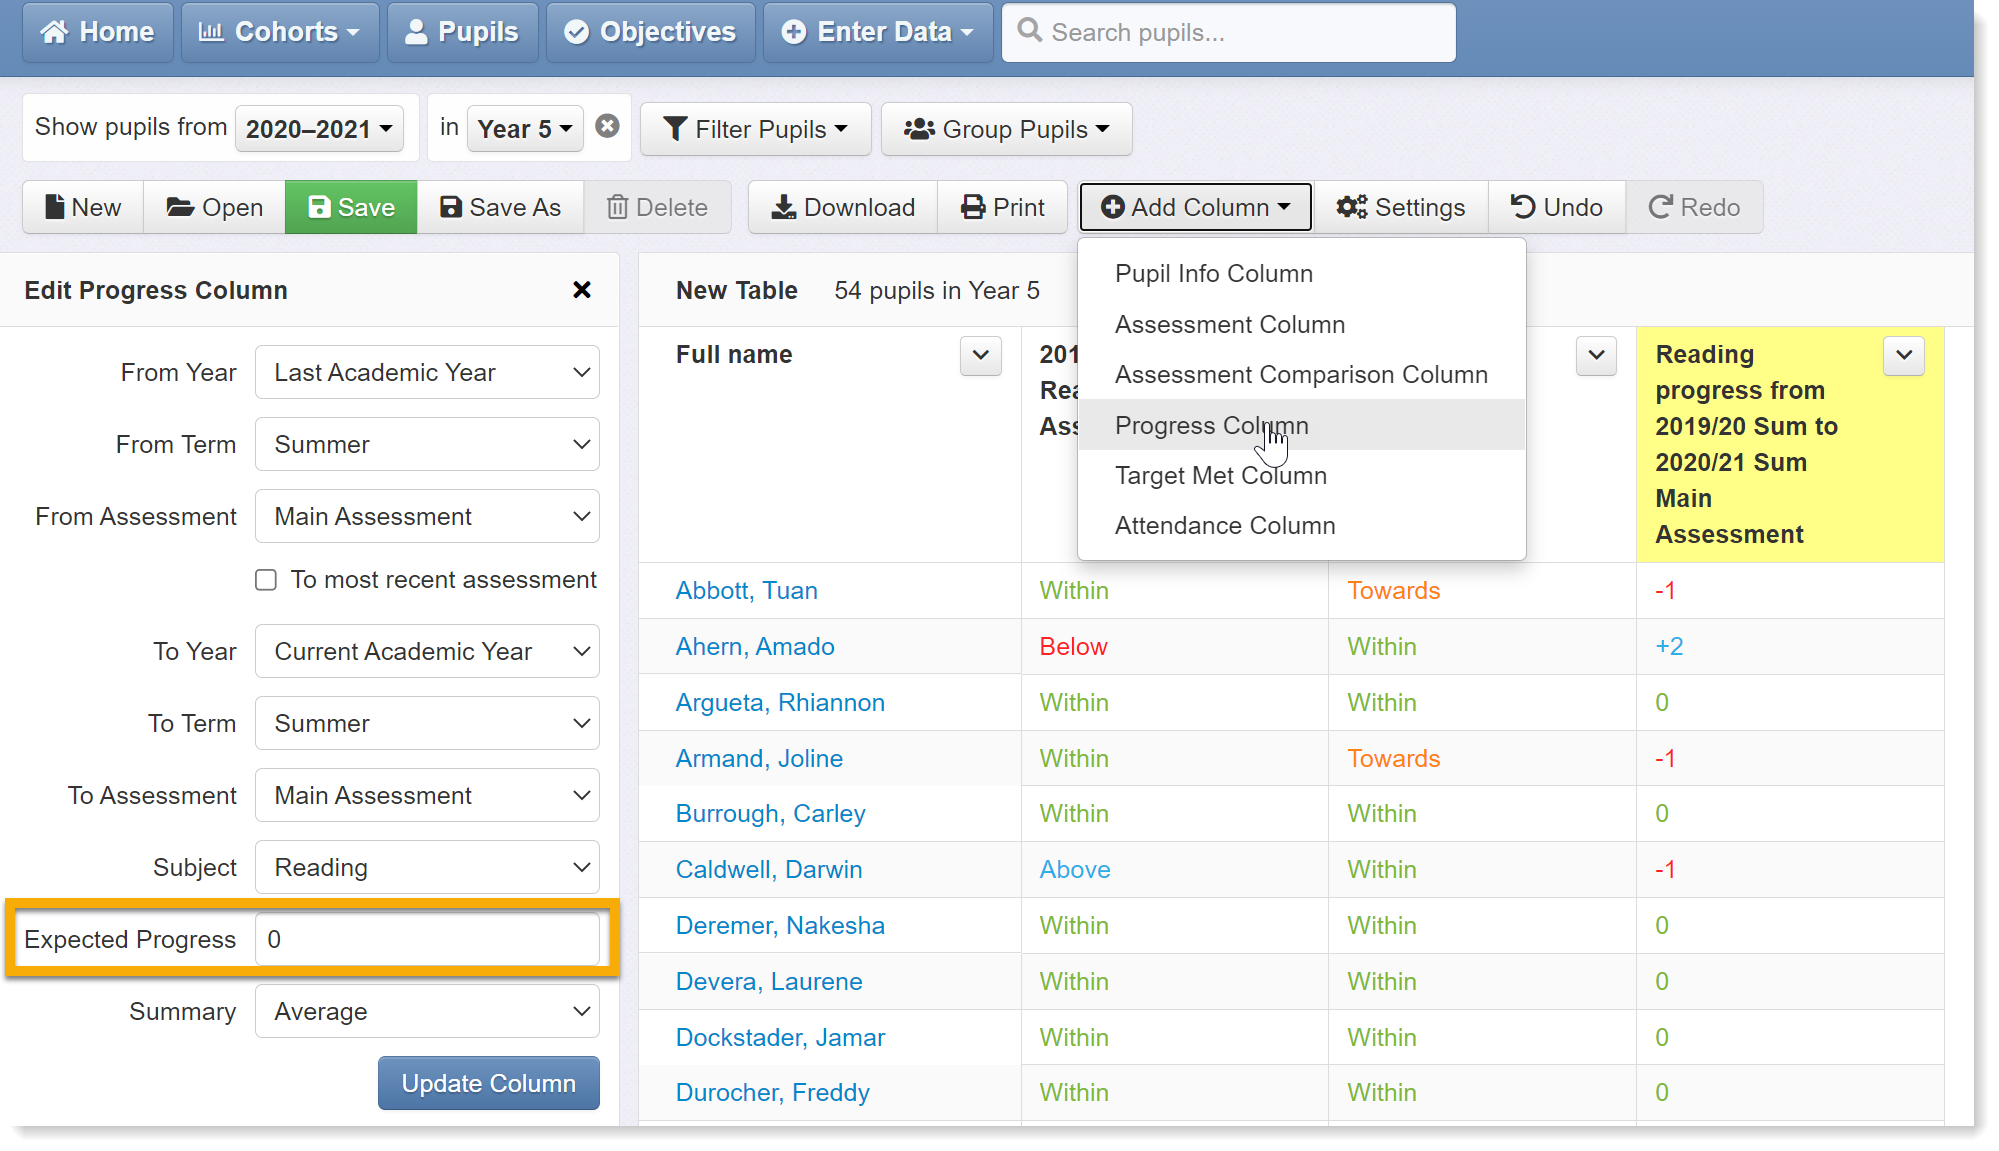
In a Tables report, the Expected Progress box is found when adding a progress column (see screenshot).
3) Headlines
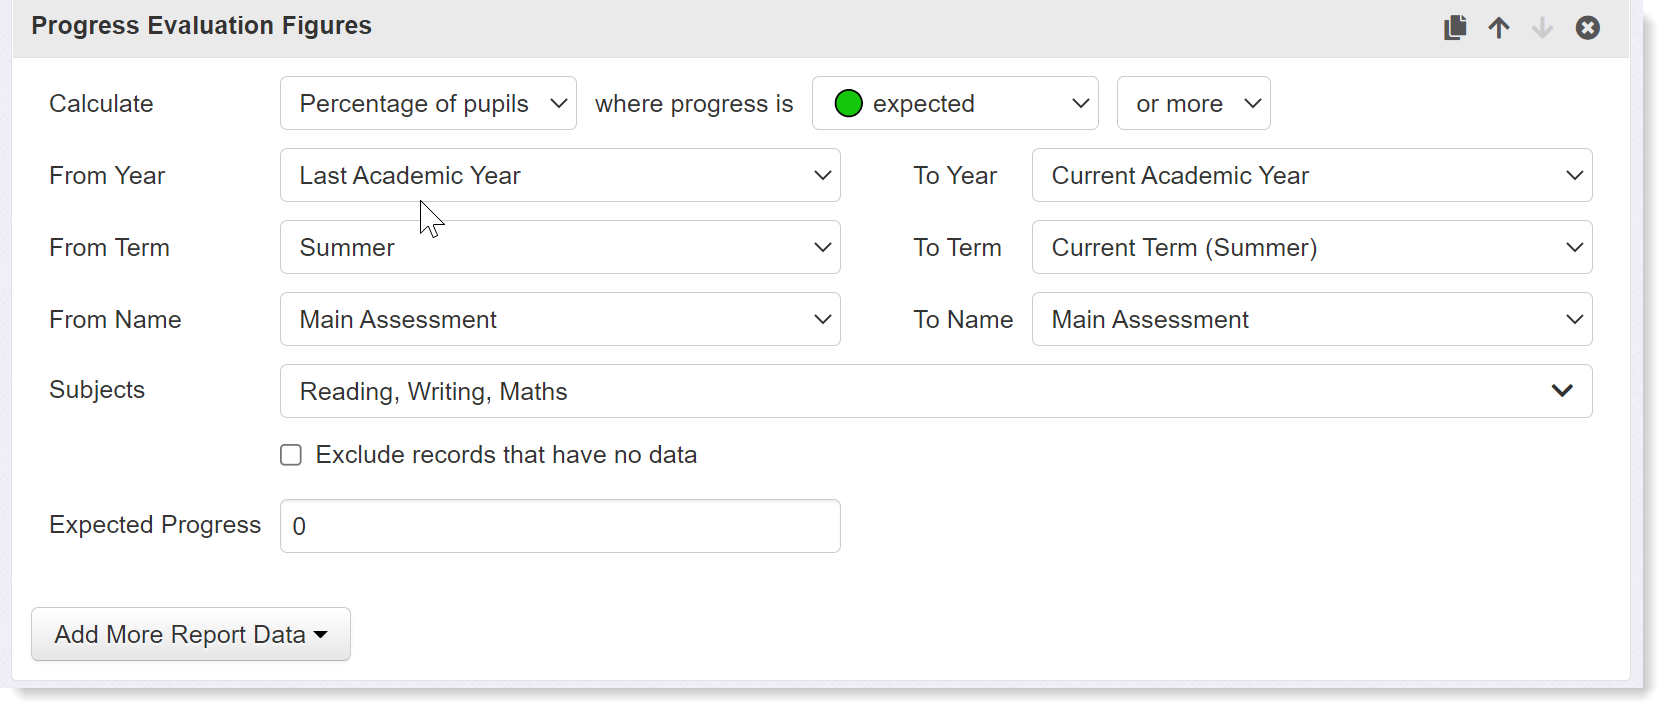
In a Headlines report, the Expected Progress box is found when adding any of the progress elements:
- Progress Evaluation Figures - calculates percentages making below expected, expected, and above expected progress
- Progress Band charts - adds a Progress Overview-style bar chart to the report
- Progress Averages - calculates average progress scores in the same way as the summary rows in a Table report
What figure should be entered into the Expected Progress box?
This depends on the type of data you are working with:
1) Point In Time Assessment (PITA)
If your report involves PITA-style teacher judgements, whereby pupils are assessed as, for example, below, working towards, expected, or above, reflecting their security in the curriculum based on what has been taught so far, then you can leave the expected progress figure as 0. In such an approach, teacher judgements are directly comparable regardless of term and will often remain static i.e. pupils do not move up through a series of steps. This is akin to a simple Value-Added model centred on zero, and pupils that have moved up a band will be assigned a score of +1 whilst those that have dropped back will receive a score of -1. Percentages making 'expected progress' will include those pupils with scores of 0 or more; average progress will be calculated by averaging these scores for the group or cohort concerned.
Note: if you are comparing latest teacher assessments back to EYFSP (ELG) or KS1 results then expected progress should be left as 0. Insight compares the evaluations of these various assessments schemes and treats them as comparable.
2) Steps-based models
If you are using a steps-based assessment scheme where pupils are expected to make a certain number of points per year, then enter the expected rate of progress according to the period set e.g. 1 point per term, 3 points per year, 6 points for 2 year period etc.
Note: if you are comparing the pupil's latest steps-style assessment back to EYFSP or KS1 results - which are not on the same scale - then expected progress should be left as 0. Insight will compare the evaluation - i.e. the colour-coding - of the start and end assessments in order to classify pupil progress.
3) Standardised scores
When working with norm-referenced standardised tests - from the likes of Rising Stars, NFER, GL and Star - we may not expect scores to change much from one test to the next and could therefore leave the expected progress figure as 0. The problem with this approach is that it will only count those pupils whose scores have remained exactly the same as having made expected progress. In reality, however, standardised scores are noisy and a certain amount of fluctuation is normal. It therefore makes sense to set a margin of error rather than a precise figure in the expected progress box. If test results include a confidence band around pupils results, you can use this as a guide - roughly work out the average confidence band for the cohort (it will be a +/- figure). Alternatively, set a margin of error of +/-5 to start with and check how the results align with your perceptions of pupil progress. Over time an appropriate figure will become more apparent.
The expected figure is entered as -5-5, which translates as 'between - 5 and +5':
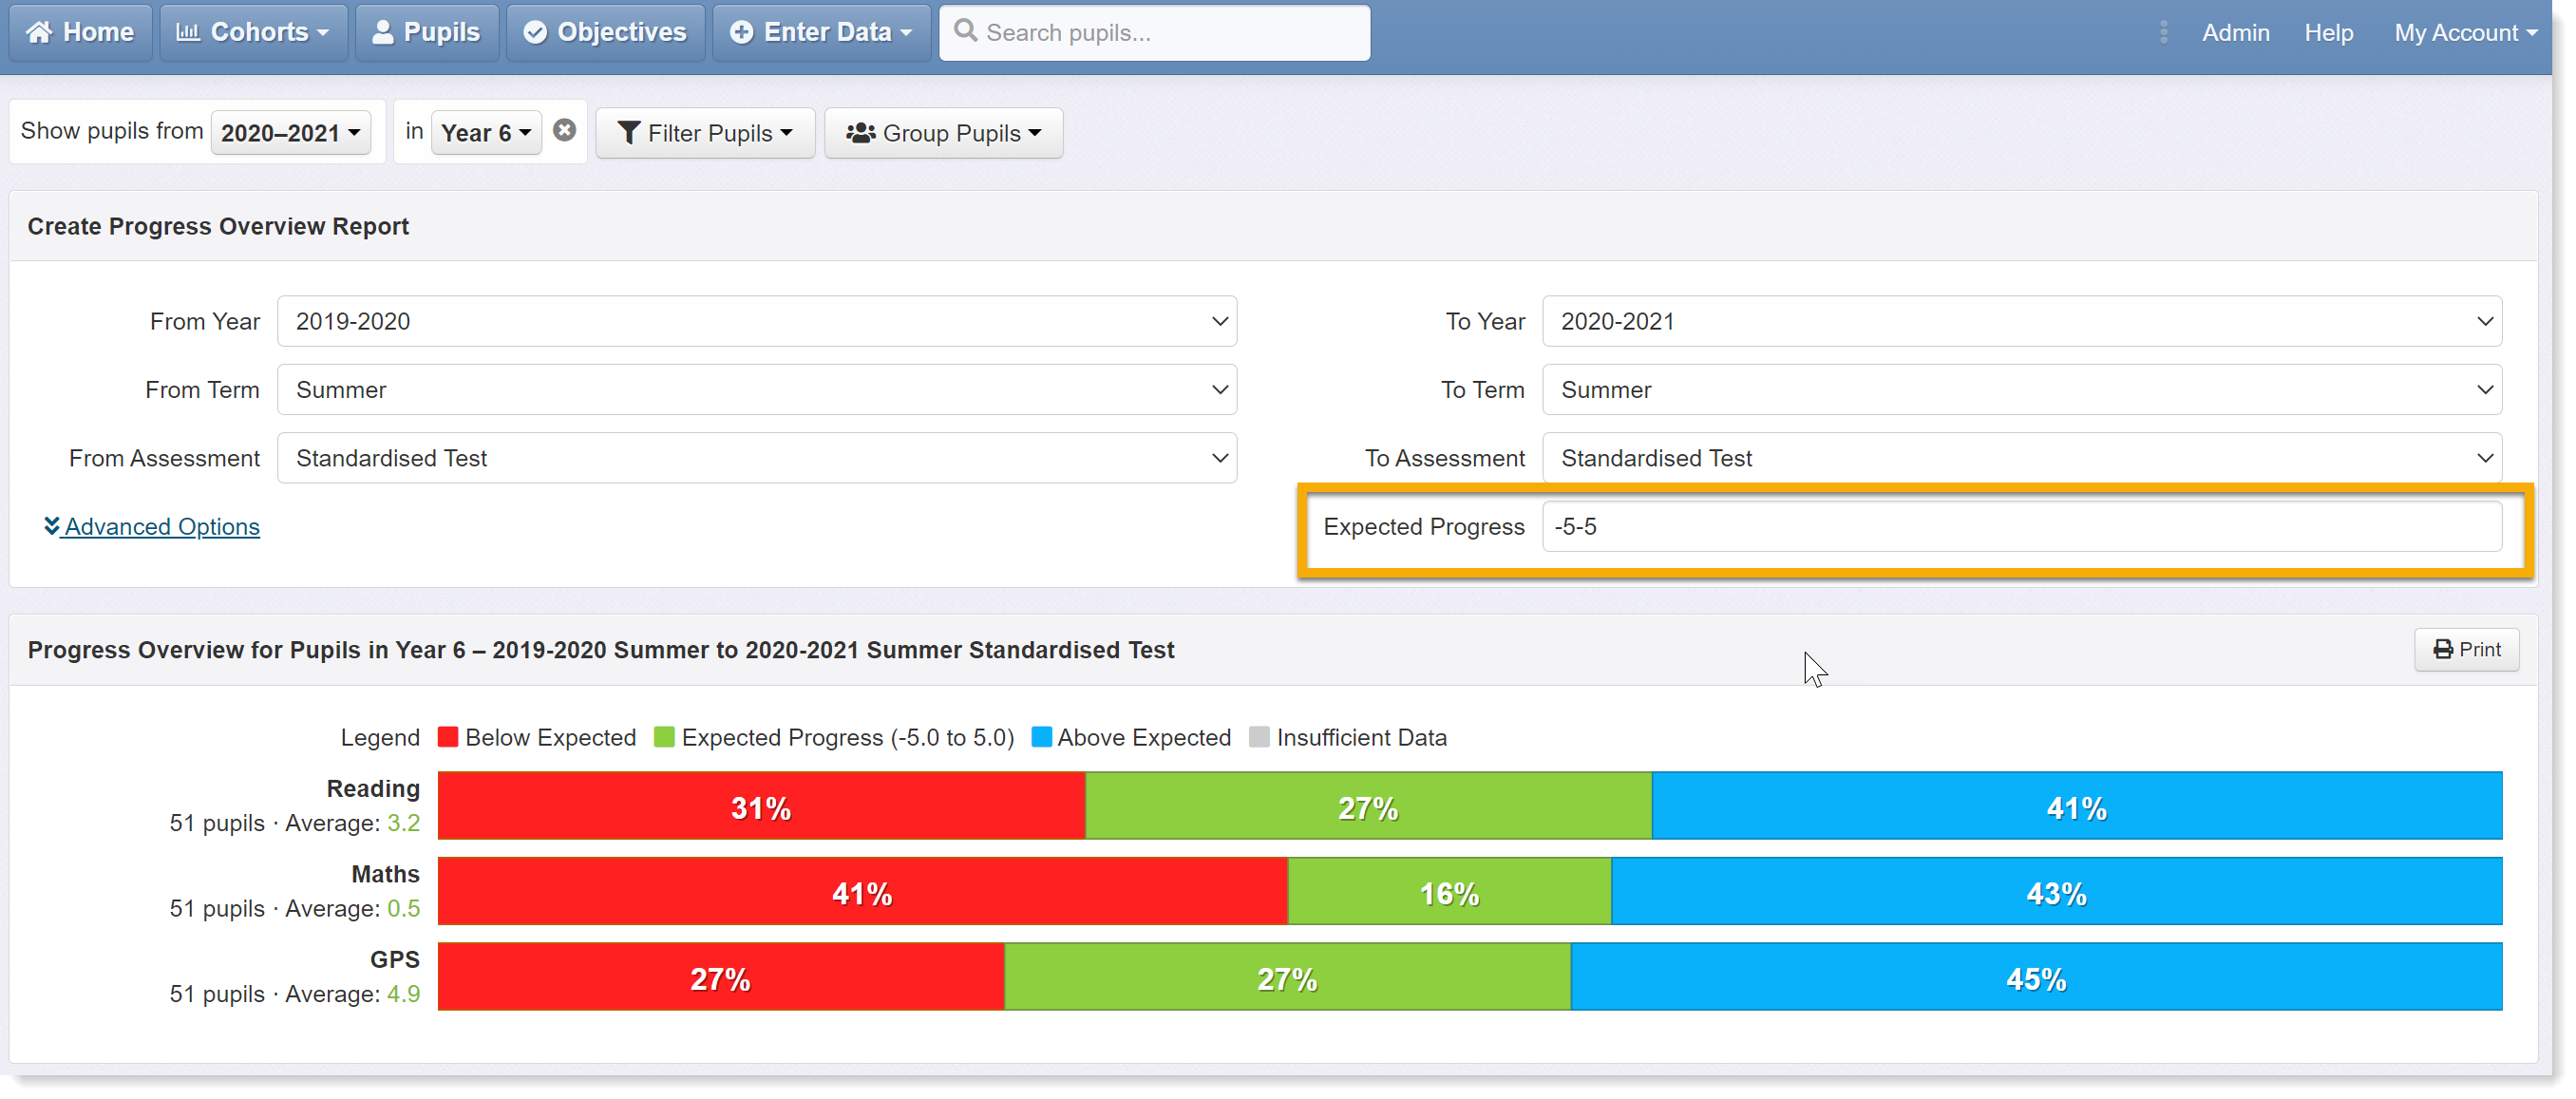
The report shows that, in reading, the scores of 31% of pupils dropped by more than 5 points whilst 41% saw their scores increase by at least the same amount, and 27% of pupils' scores remained within the set range.
Note: If you compare standardised scores to teacher assessments in these reports, expected progress should be left as 0. Again, Insight will compare on the basis of evaluations - i.e. colour-coding - of each assessment and will treat, for example, scores in the range 95-115* as comparable to an 'expected' teacher judgement. A pupil that was assessed as working towards expected at KS1 and now has a score of 101 will receive a progress score of +1 in this instance.
* Depending on the score thresholds the school has set.
4) Age Equivalent Scores (Reading Ages)
Many schools record reading ages in Insight and these can also be used in progress reports. Unlike standardised scores, we do expect these data to increase over time and setting expected progress at 0 will therefore not provide meaningful results. As a start point, we can work out the number of months that have passed between assessment points and set that as our expected rate. For example, reading age assessments are taken 6 months apart:
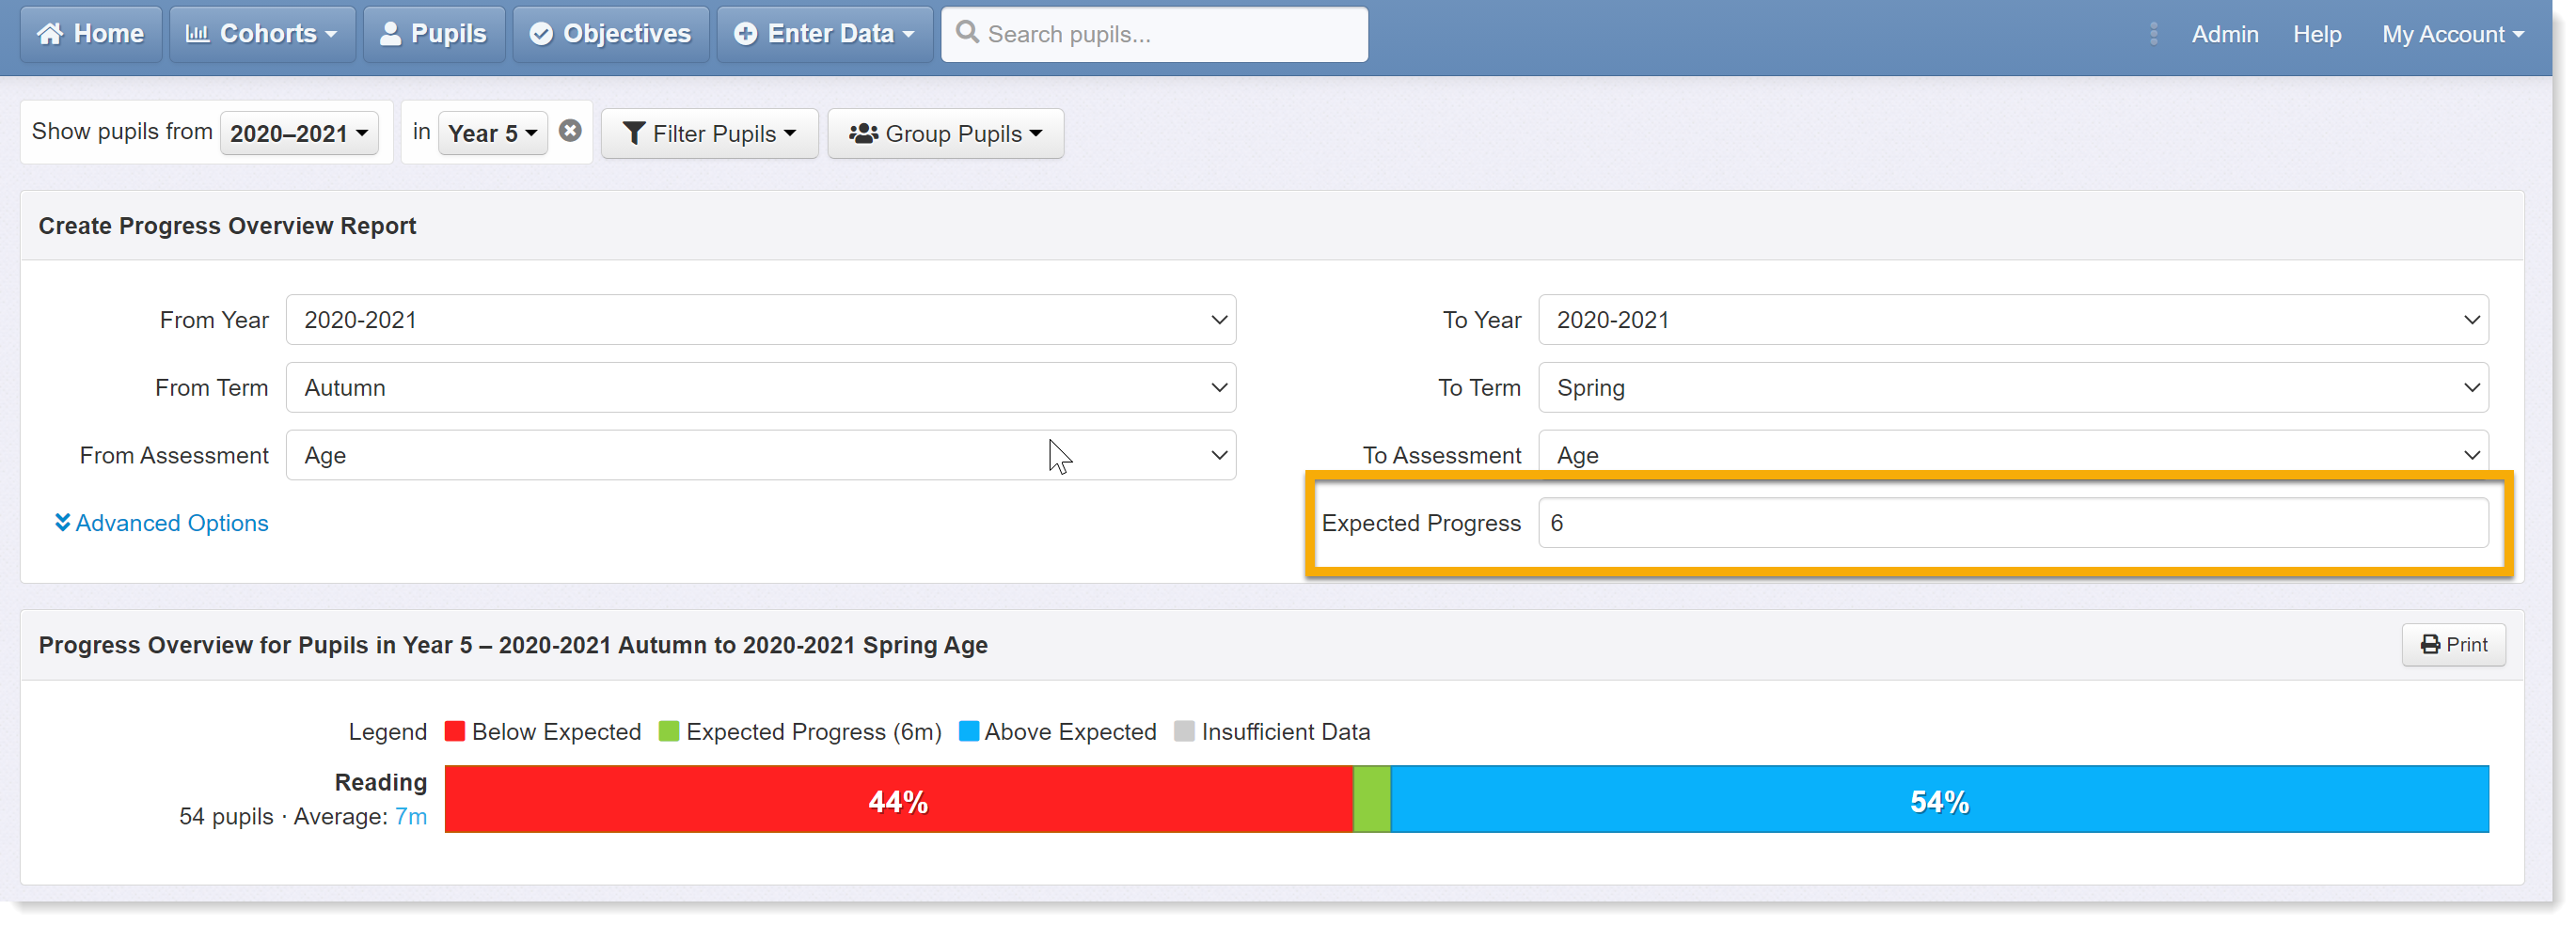
This report shows that 44% of pupils' reading ages improved by fewer than 6 months and 54% saw a greater than 6 month gain. Only 2% of pupils matched the expected rate. The problem here is that age equivalent scores are very noisy - we can apply +/- 6 month margin of error to a pupil's reading age as a rule of thumb - and we therefore need to expand our expected rate into a range.
The expected progress has now been changed to 0-12 months, which means that any pupil whose reading age remains the same or has increased by as much as 12 months, will be counted as having made 'expected progress:
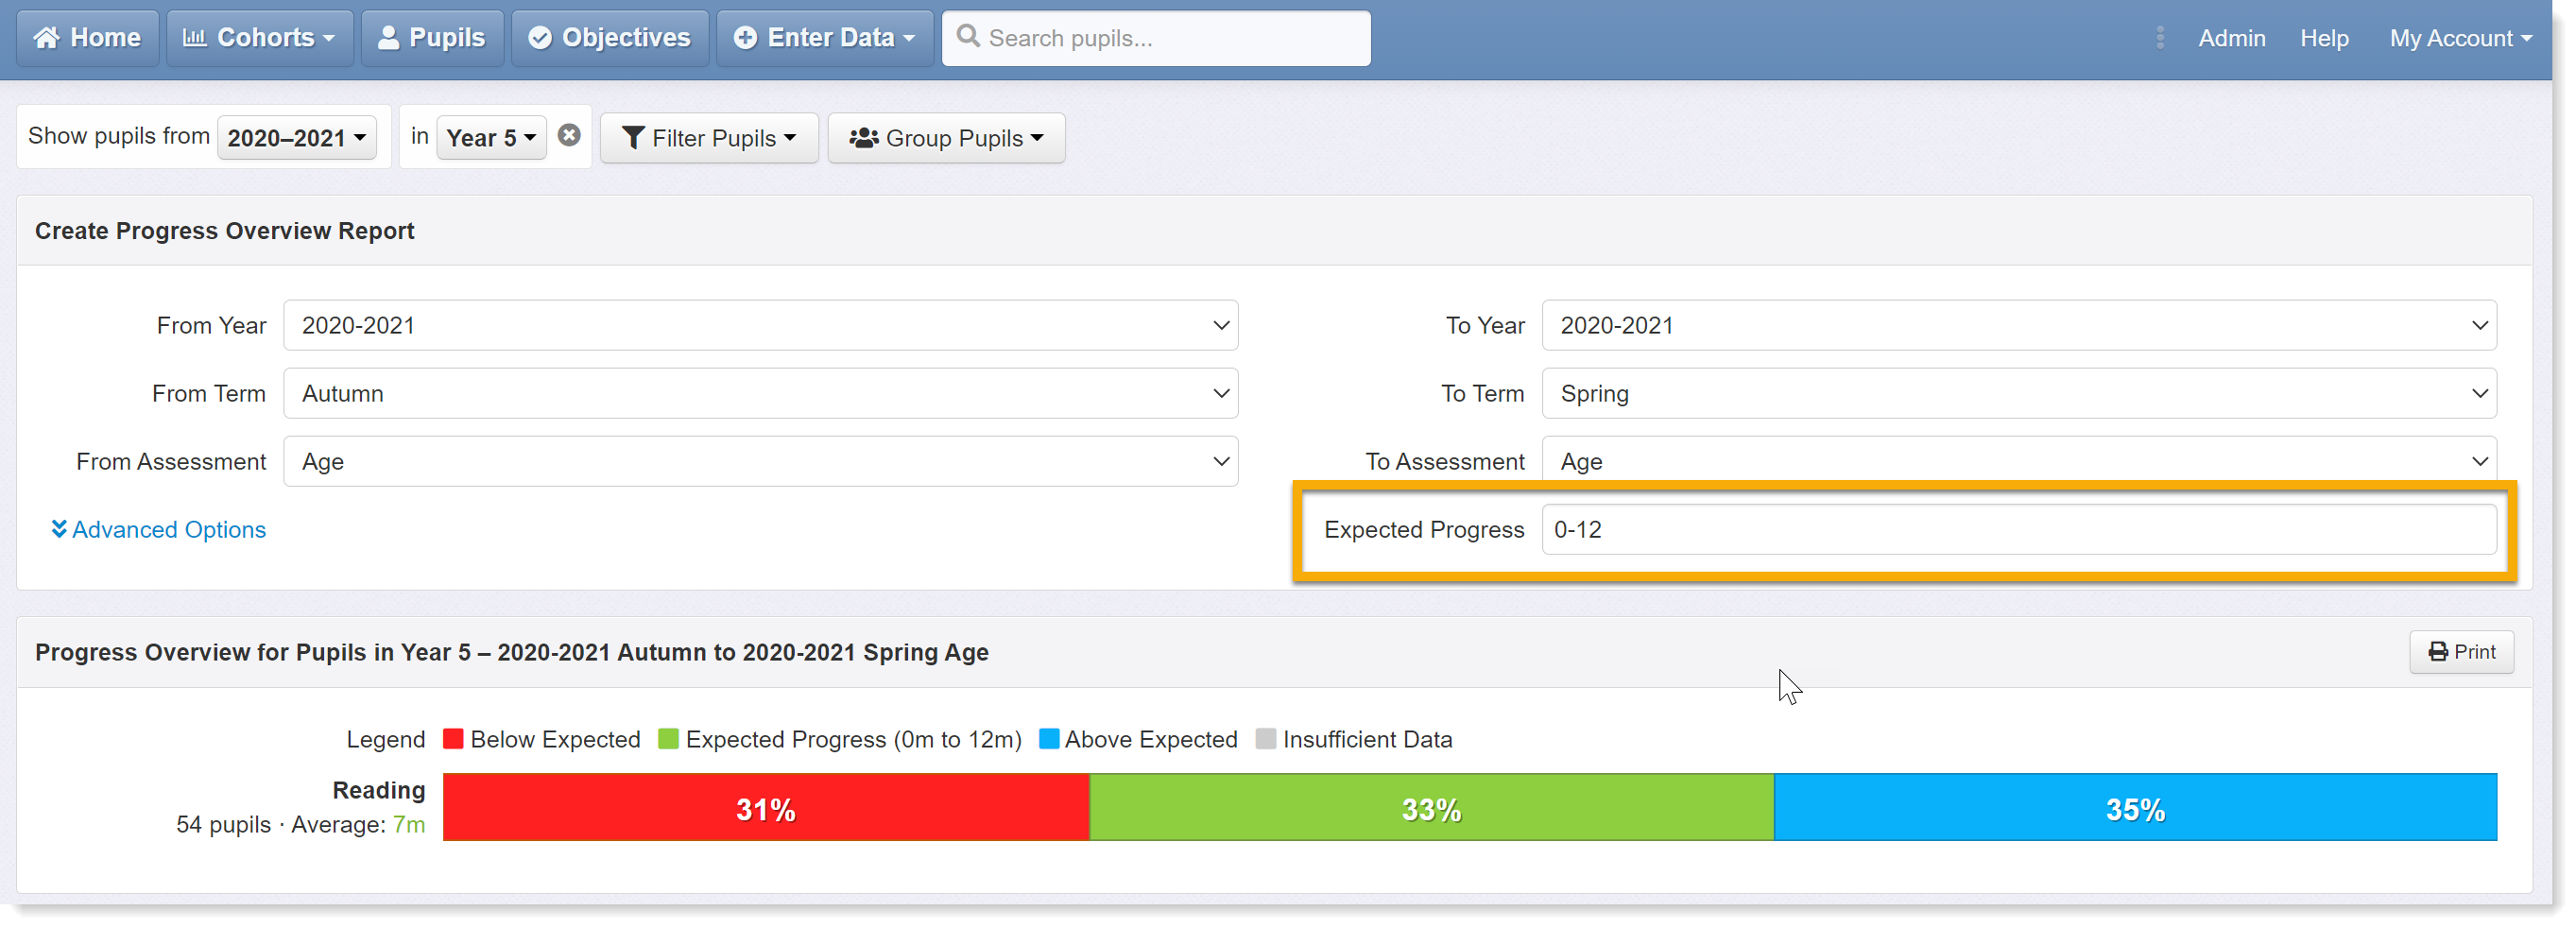
The report now shows approximately a third of pupils in each category, which seems more realistic. Again, you are likely to get to know the idiosyncrasies of your data with time, which will help you set appropriate rates. Also, it is worth contacting your test providers for guidance.
5) Raw Scores
Progress can be measured between raw scores, if all the scores have evaluations applied. If you see raw scores in Insight in black text, these don't have evaluations - check the thresholds on the marksheet used to record the scores for that cohort.
The rate of expected progress must include the same denominator as the raw scores, eg 5/25. It's not recommended to try to measure progress between two test scores with different denominators.
6) Other types of data
These reports will work with other types of data including scaled scores, phonics scores, and book bands. If you have data stored in Insight, the chances are these reports can handle it. As always, be aware of the limitations of data and consider whether a progress calculation is appropriate or meaningful.
We hope this help guide has been useful. Please get in touch if you need any further support or have any feedback.