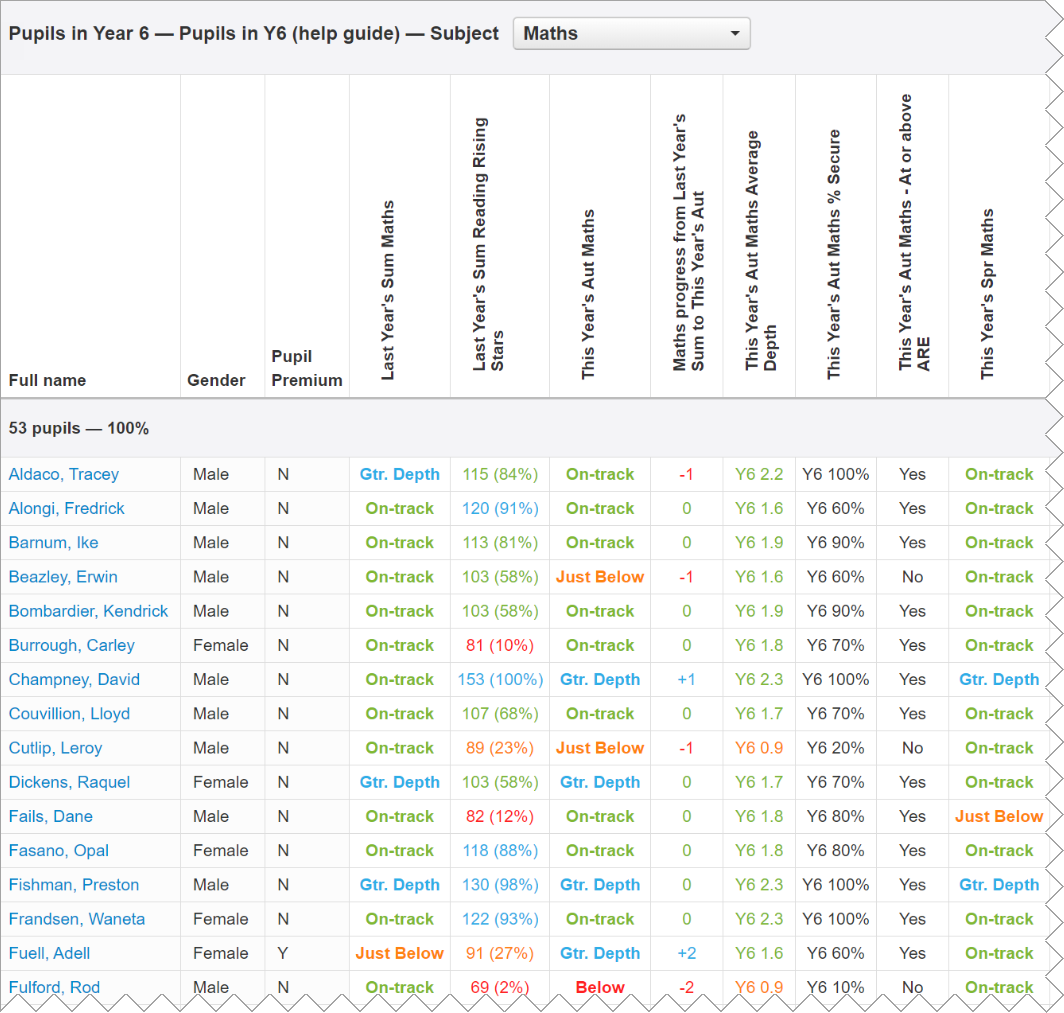
Using the Tables report

The "Tables" report is a fast and flexible way of getting any pupil level assessments and information you need into one place. If you've ever had to transfer data from multiple sources into your own table in Word or Excel, and resorted to calculating percentages for each cohort and group manually every term, then Tables is the report for you. Tables are a super-powerful one-stop shop for all your data needs.
Working with Table Templates
Insight comes with some preset tables built in, or you can start from scratch and bring in anything you like. You can save tables for fast access next time.
Think of these as "templates". When you save a table, Insight only stores details of which columns of data and information you've added - not the pupil selections you've made. This means you could save a single table which pulls in key data for the current academic year; whenever you view that table you can quickly switch which pupils you're looking at and change any groupings on the fly. This saves you having to open one table for each class, year group, etc.
Once you have saved a report, it will be accessible to all Insight users at your school.
It's worth getting a feel for how the "parameter" options work as well, which allows you to do more with a single table (rather than creating lots of very similar ones). More on this below!
Tables can be downloaded to Excel if you want to save a permanent copy of a specific table of data (also useful for printing, since Excel handles this much better than web browsers).
Open, Build, Edit and Delete Tables in Insight
Open an existing Table
Go to Cohorts > Tables:
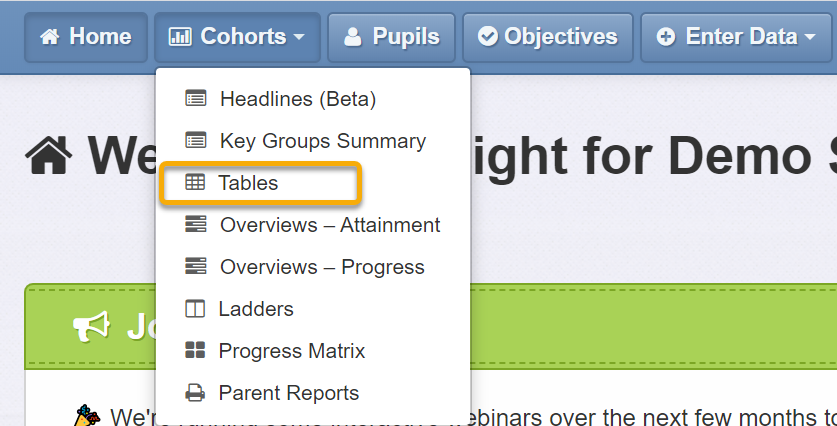
Insight has some preset tables that you'll see via Cohorts > Tables > Open table. Any tables that you build and save will also be shown here.
Create and Edit a Table
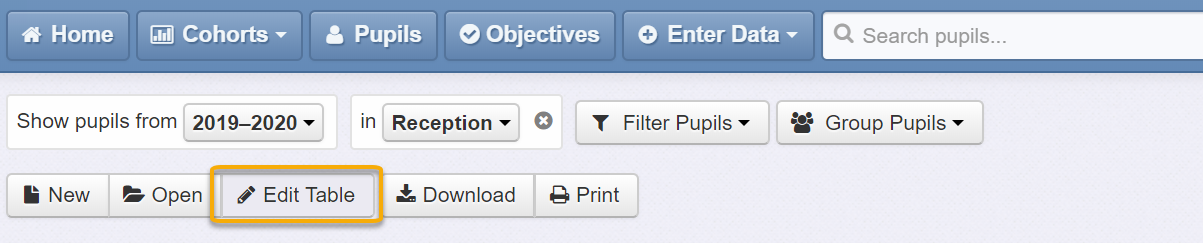
Click the Edit Table button to make changes to an existing table. Or click New and then Edit Table if you want to create something new.
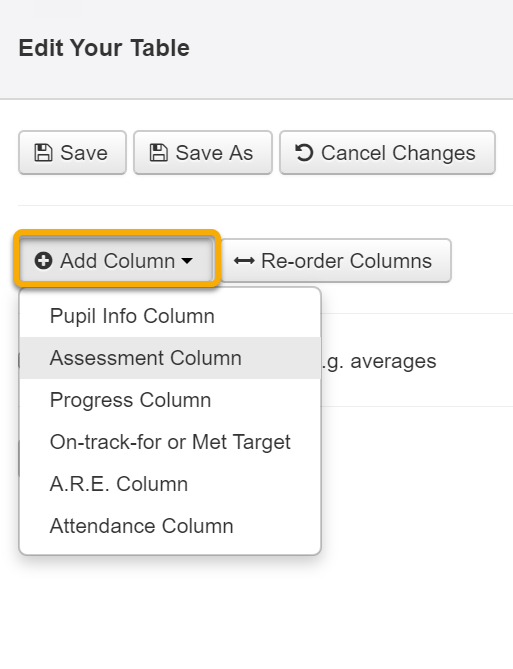
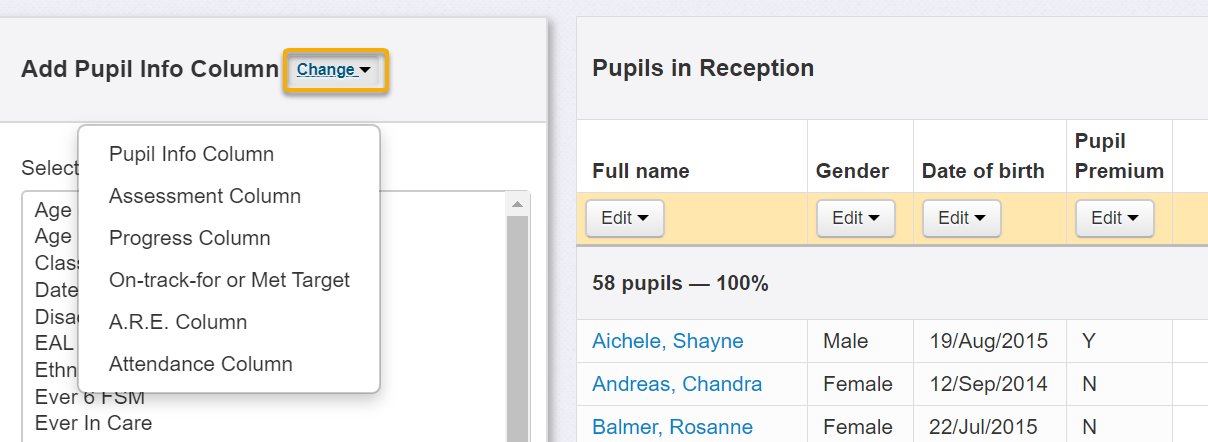
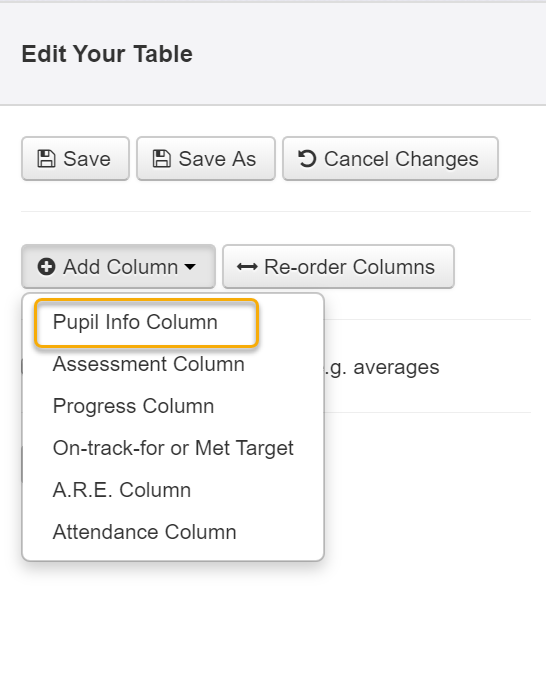
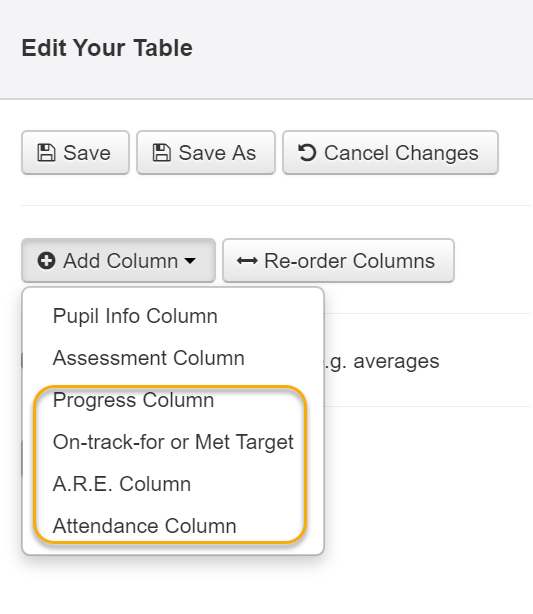
To begin building your table, select the 'Add Column' drop-down. You'll see various types of column you can add.
Add one column at a time, clicking on 'Add Column to Table' and 'Add Another'. When adding another column, click 'Change' to choose a different type:
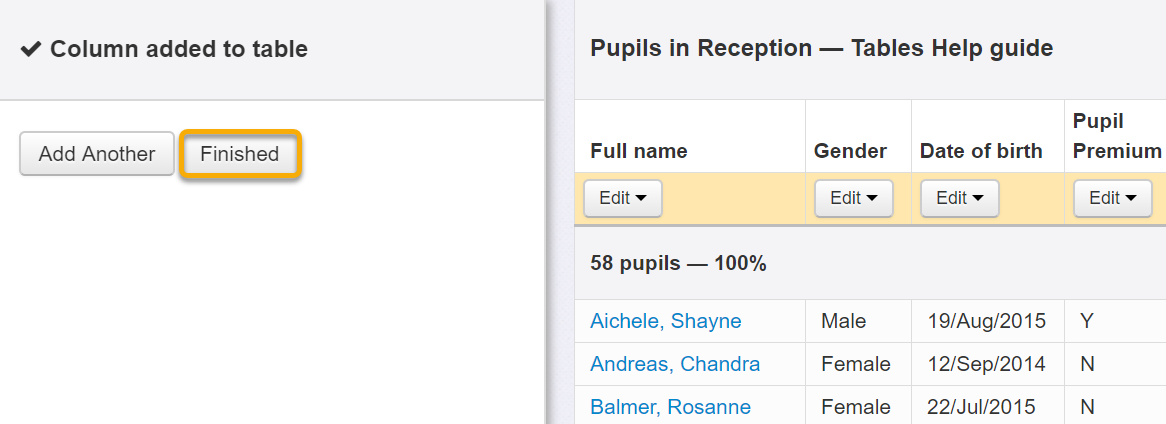
Once you have the pupil data you need, click 'Finished':
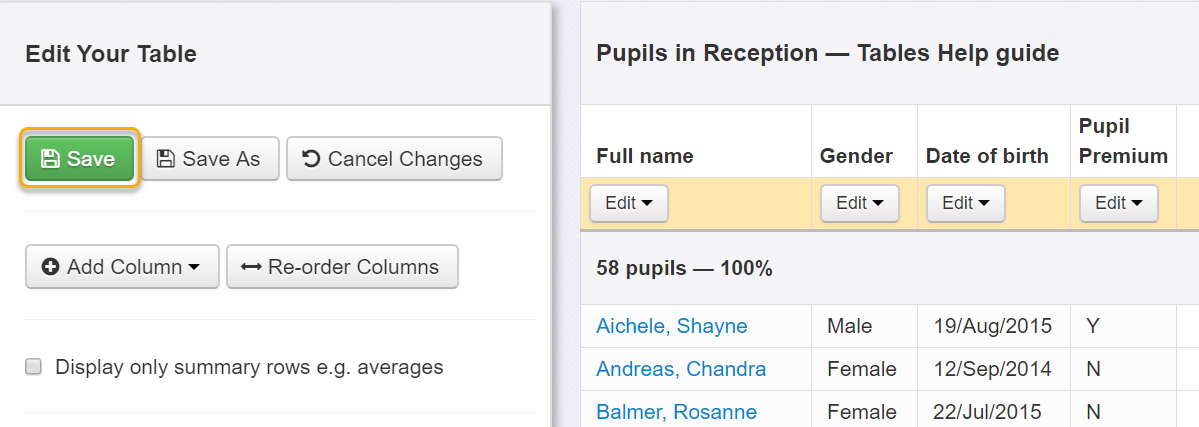
Then 'Save', after which you'll be prompted to enter a name for your Table:
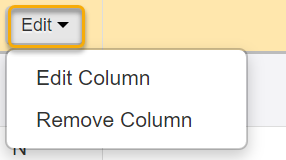
The 'Edit' button at the top of each column allows you to Edit an individual column within each report or Remove an unwanted column.
If you have opened a Table and the Edit column isn't showing, simply click on the 'Edit Table' button above the Table
Column Types
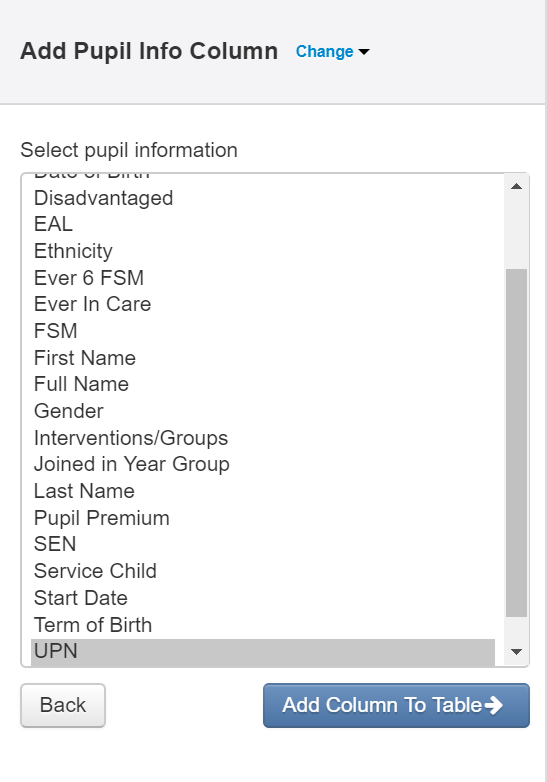
Pupil Info column:
Here you'll find a lot of contextual data that you can add to your table:
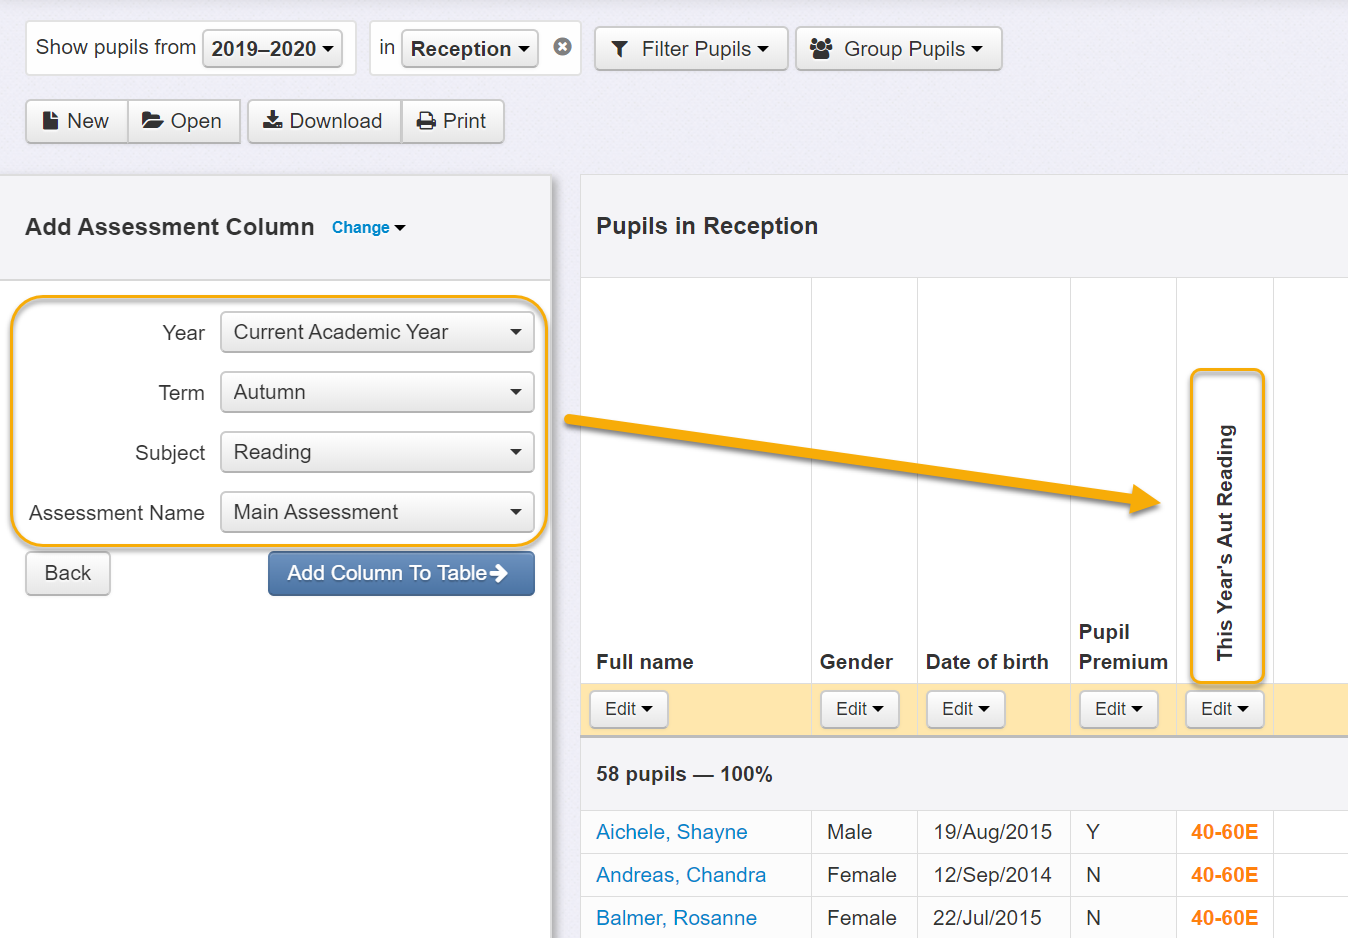
Assessment Column
Here you can choose any of the assessment data that is stored in your account.
You can choose to specify particular types of data you want to see and 'Edit' the column at any point, either during the build or once the table has been saved:
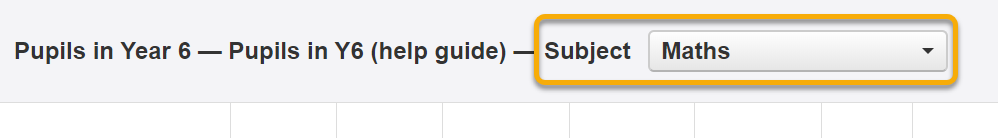
Parameters
You can choose term and subject "parameters" instead of choosing specific terms or subjects. These give you a dropdown menu of options in your table, allowing you to change the term or subject on the fly and diminishing the need for several similar tables on your system.
More options to add to your Table:
- Progress Column. Bring in the progress between any two points. Useful for any steps style assessments which are designed around an upwards progression model (such as Development Matters).
- On-track-for or Met Target. An historical column, only useful if your system includes "Prediction" assessment types.
- A.R.E. (Age Related Expectation) Column. Shows whether pupils are at or above expectation (or other comparisons) for a particular assessment. The summary row will show the % of the cohort at/above expectation.
- Attendance Column. Choose attendance information to include. Thresholds can be configured in Admin > Change School Settings.
Rename and Delete a Table
Once a Table has been saved, the 'Rename Table' and Delete' Table options will become available:
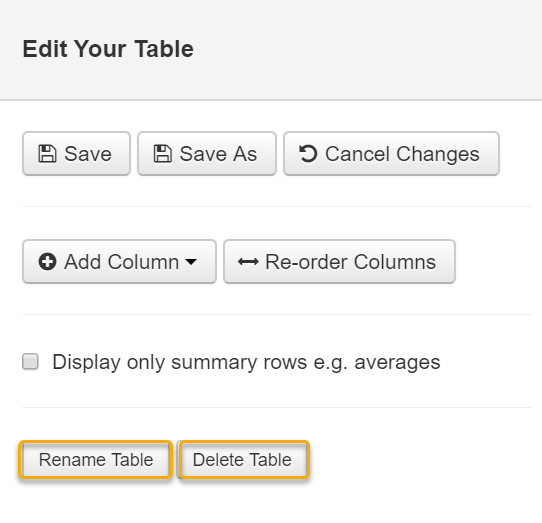
The 'Save As' button can be used to keep the existing Table and create a copy with a different name.
Further Editing
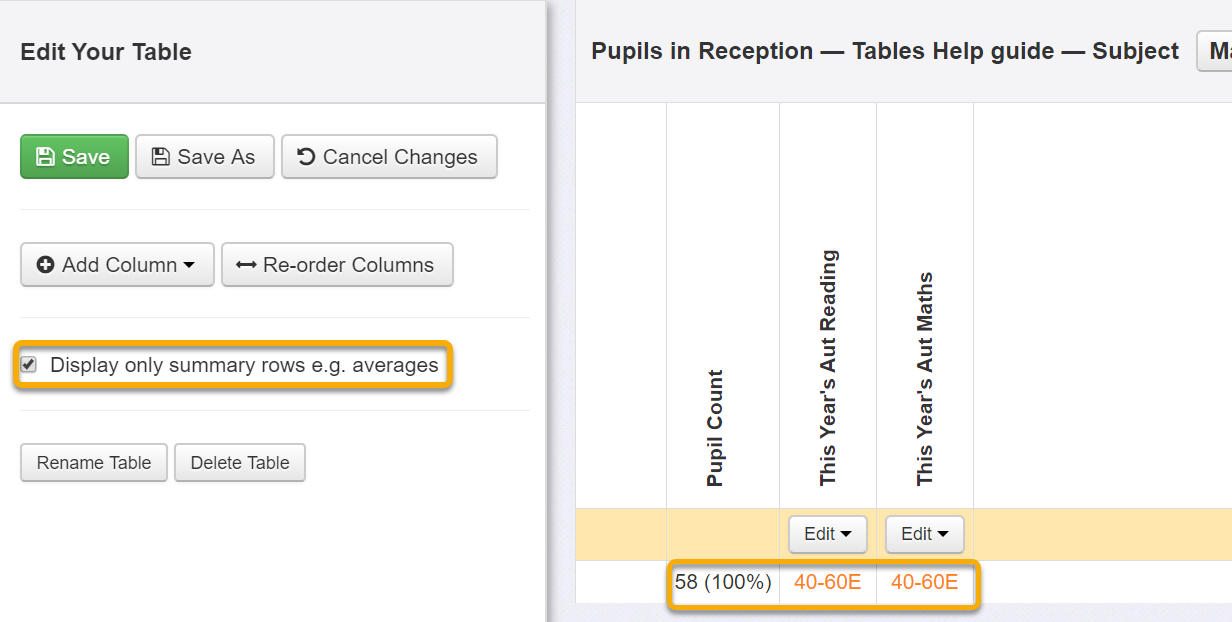
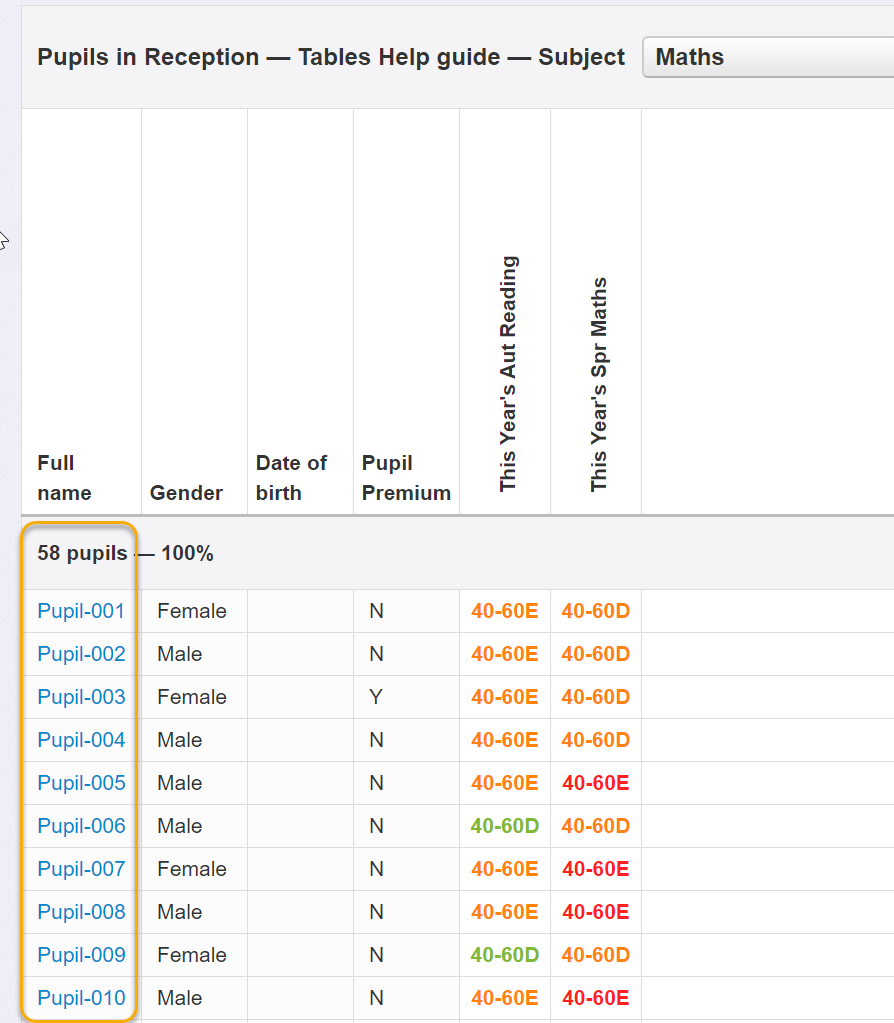
Ticking the 'Display only summary rows e.g. averages' box will hide all pupil names and give an average of assessments. Useful for Governors and Ofsted:
Switching on My Account > 'Private Mode' is another way of anonymising data throughout Insight:
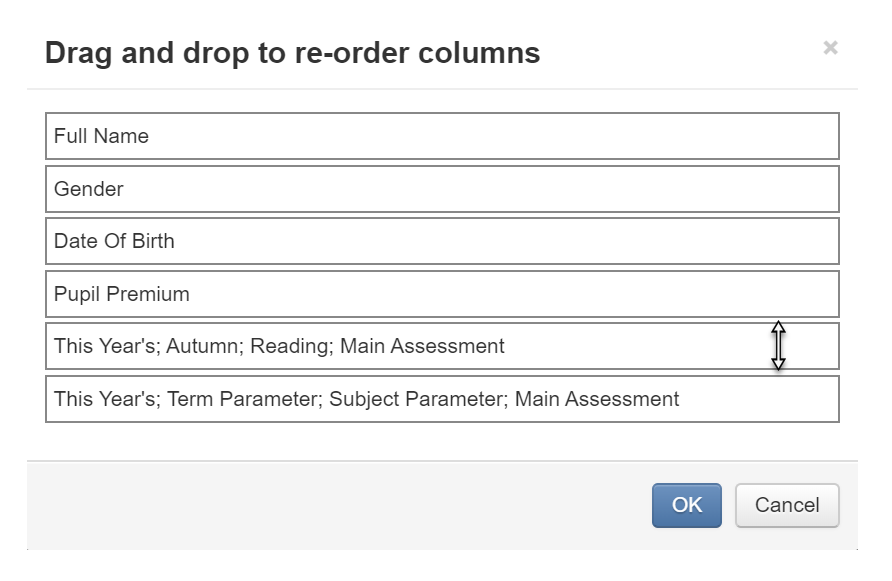
You can re-order columns at any time via the Edit Your Table area by simply dragging and dropping on a column:
See below for a video tour of "Building Custom Tables", courtesy of James Pembroke: