Using the Mosaic report for Trusts
 Updated
Mosaic reports are designed to enable you to compare and analyse data for the schools across your Trust in multiple, distinct, sections.
They are available for Trusts only, not individual schools.
They are able to include multiple sections covering different data types; including contextual demographics, statutory assessment data and other assessments used in your schools at specified points in time.
As such, they are ideal for creating a long form report, with an optional written narrative, focussing on multiple pertinent data types.
In this guide, we'll cover how to create a report, how to add different sections and how each section type works.
Creating a new report
When you run Mosaic for the first time, you will see an empty screen with a single New Report button.
Click New Report to begin.
When you create a new report, a basic table with some demographic data for each school is automatically added to get you started.
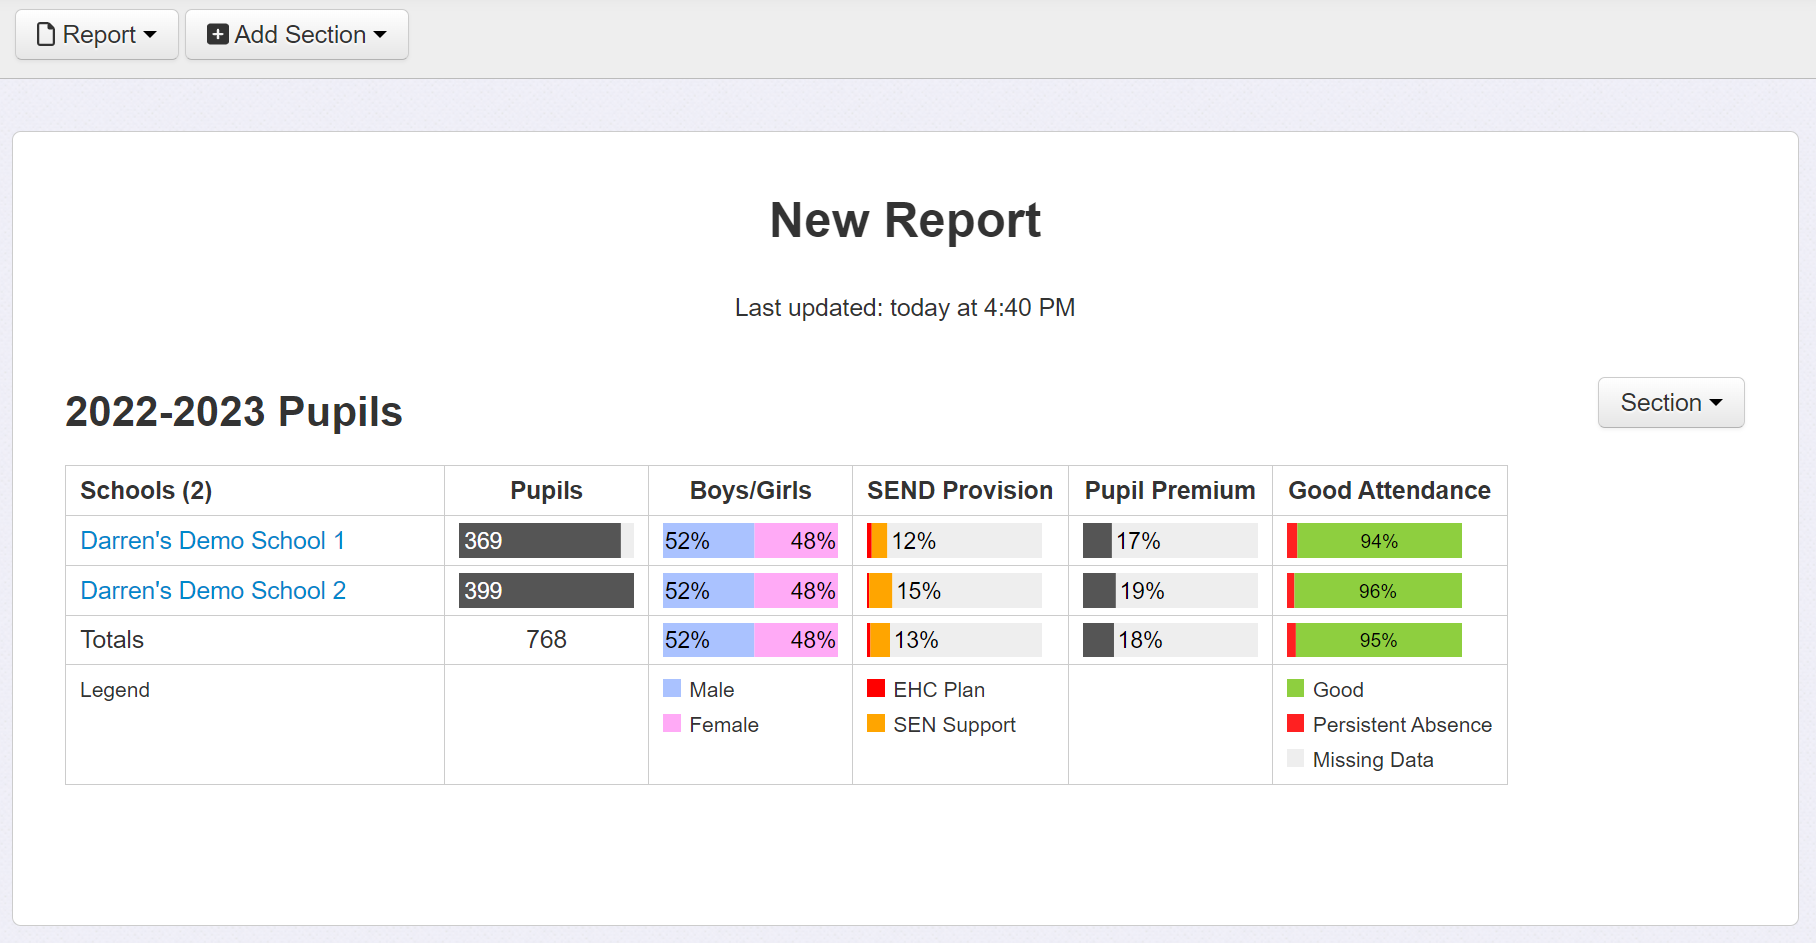
To the right of the table is a Section menu. This contains the specific settings for the table and is covered later in this guide.
At the top is a Report menu, from which you can perform common operations, such as refreshing the data in the report.
The Add Section menu is where you can add additional data tables. Each section type is detailed below, with the specific Section Settings and configuration details in each case.
Section Settings available for all
The following options are available for all Sections in the report via the Section menu.
Option | Function |
Add/Edit Comments | Allows you to add text beneath the selected Section. This could be a narrative, explanatory piece or identifying strengths/issues etc. |
Refresh | Refresh the data in the selected Section. |
Move Up/Down | Allows you to reposition the Section within the report. |
Duplicate | Creates a duplicate of the selected Section. Useful if you want to add historical data of the same type, for example. |
Delete | Delete the selected Section from the report. |
The following options are available for all sections in the report, apart from Custom, within Section - Settings.
Option | Function |
Show Schools in table | Displays a row for each school. |
Show totals in table | Displays a row with total values for all schools. |
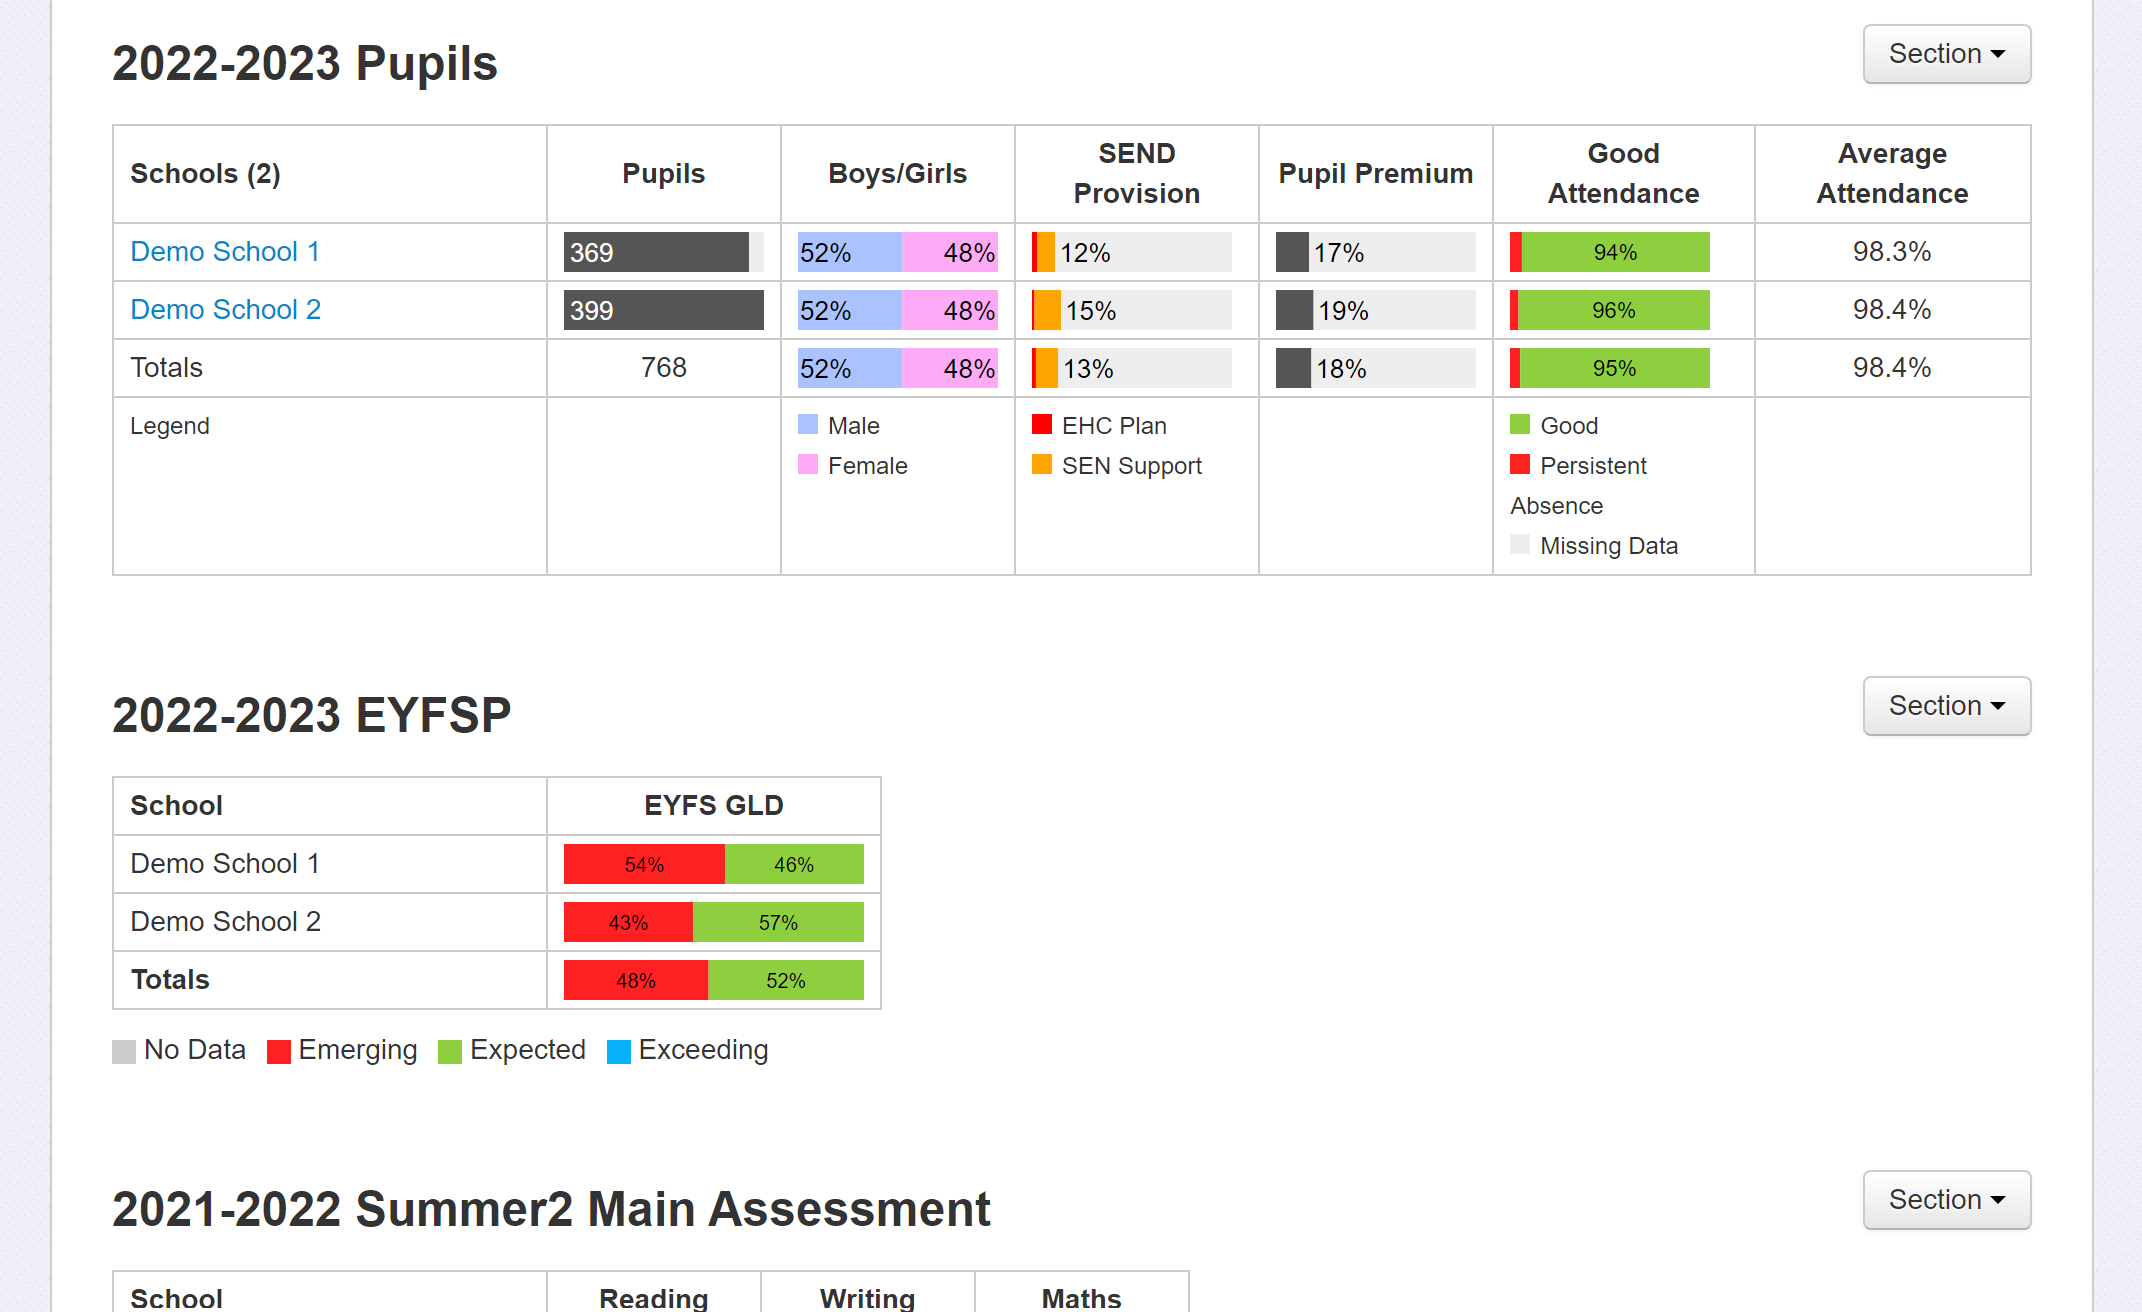
Pupil Demographics
Pupil Demographics show contextual data for the pupils and are a good way to get a visual representation of the pupil characteristics in your schools.
Section Settings
By default, the table will include pupils from the current academic year. This can be changed if required. For example, you might want to include two tables, one for the previous and one for the current academic year.
Section Heading | Column Function |
Pupil Count | Total of pupils on roll |
Boys/Girls | % of Boys and Girls |
SEND Provision | % pupils on EHC and SEN Support |
Pupil Premium | % pupils with Pupil Premium |
Good Attendance | % pupils with Good Attendance. This figure is >=90% by default, but can be amended via the Account menu - Admin - Attendance Thresholds % pupils with persistent absence. These are pupils who miss 10% or more sessions. |
Average Attendance | Average % attendance |
EAL | % pupils with English as an Additional Language |
EYFSP Assessments
Shows the breakdown of EYFSP assessments for the chosen academic year for the chosen subjects. The percentage of pupils achieving a Good Level of Development (GLD) may also be included.
The Section Settings enable subject/GLD selection and to display as a stacked bar chart or percentage values in columns.
Phonics
Shows the percentage of pupils achieving the pass mark in the Year 1 Phonics check. Additionally, a combined column for Year 1 pupils and Year 2 pupils taking the re-check is displayed plus another column just giving the results for Year 2 pupils.
The Section Settings also allow the display to be switched from a stacked bar chart to percentage values in columns.
KS1 SATs
Shows the SATs teacher assessment results for the end of Year 2 for Reading, Writing, Maths and Science.
The Settings allow subjects to be toggled on or off and for the display to be as a stacked bar chart or as values in columns.
KS2 SATs
Shows the SATs test and teacher assessment results for the end of Year 6 for Reading, Writing, GPS (Grammar Punctuation and Spelling) Maths and Science.
The Settings allow subjects to be toggled on or off and for the display to be as a stacked bar chart or as values in columns.
Writing uses the Teacher Assessment and the others the test Scaled Score.
You can tick the box to exclude pupils with no assessments. For example, you may have removed some scaled scores if pupils are removed through the DfE checking exercise.
The key translates as follows:
No Data - No Data
HNM/PKF - Below 100 scaled score or TA for Writing
WTS - NA or TA for Writing
EXS - 100-109 scaled score or TA for Writing
GDS - 110+ scaled score or TA for Writing
Other Assessments
This section allows you to include any other assessments recorded in the schools.
The Section Settings require the selection of the Year of assessment, Term and Assessment Name. Then a selection of the desired subjects is required.
You can choose to include the percentage of pupils at or above the expected grade in all the displayed subjects. For example, it may be useful to give the percentage of pupils at expected in Reading, Writing and Maths.
If preferred, you can also exclude pupils with no assessments.
The Settings allow the display to be as a stacked bar chart or as values in columns.
Custom Table
The Custom Table allows the display of data from any of the other Sections in a single table.
Each column header may be whatever you choose.
You also have the option to choose a Compare To % value for each row. This will shade each cell according to the comparison to the value you choose, red for below, blue for above.
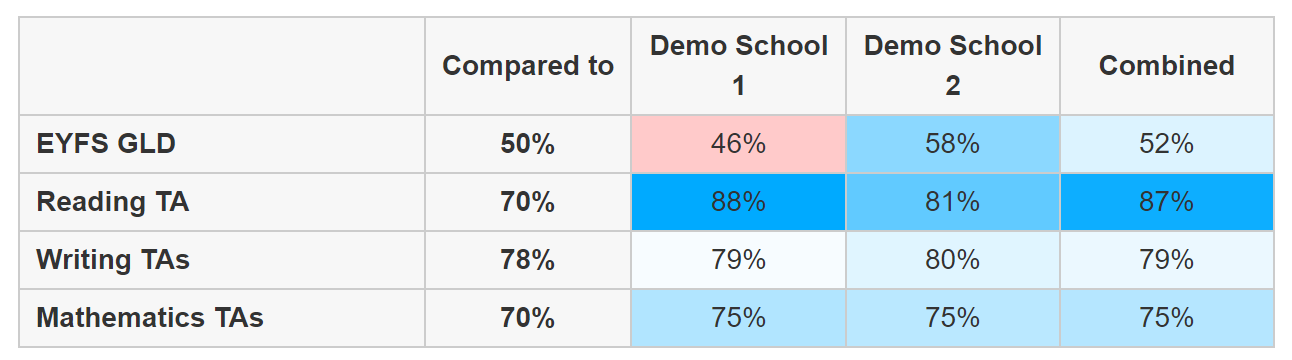
The shading works as a 'heat map' with darker shades used as the compared value is further from the school value.
There is also a Combined Attainment row available. This lets you choose an academic year, term and subjects followed by the attainment judgement grade you want to display the percentage of pupils are at, or higher/lower/only.
Each row may also have filters applied as required.
Refreshing the data
As well as having the option to refresh the data in each section, you are also able to refresh the data for the whole report.
This may be done through the main Report menu by choosing Refresh All Sections. Once a few days have passed since the last refresh, a notification will appear at the top of the report, giving the day (or date if more time has passed) the data was last refreshed. The notification includes a Refresh All Sections button.

Other Settings
Choose the Report menu followed by Settings.
The Mosaic report is designed to support printing. As such, it includes a page background. When a table has too many columns to fit on this page, they will be automatically wrapped onto the next line. Unchecking Auto wrap tables will disable this feature for the whole report.