Tables report - Monitoring Targets using Progress Columns
 Updated
This guide will show you how to compare assessments to targets to check whether or not pupils are on track to meet them.
In a previous help guide, we demonstrated how to use progress columns in tables to calculate the difference (or change) between two assessments; we also have a guide on how to monitor targets using progress overviews.
Here we'll combine these concepts to show you how to use progress columns in tables to monitor pupils' progress towards targets.
This is a fairly straightforward process with a few simple steps:
1) Create a new table report
Click Reports > Tables
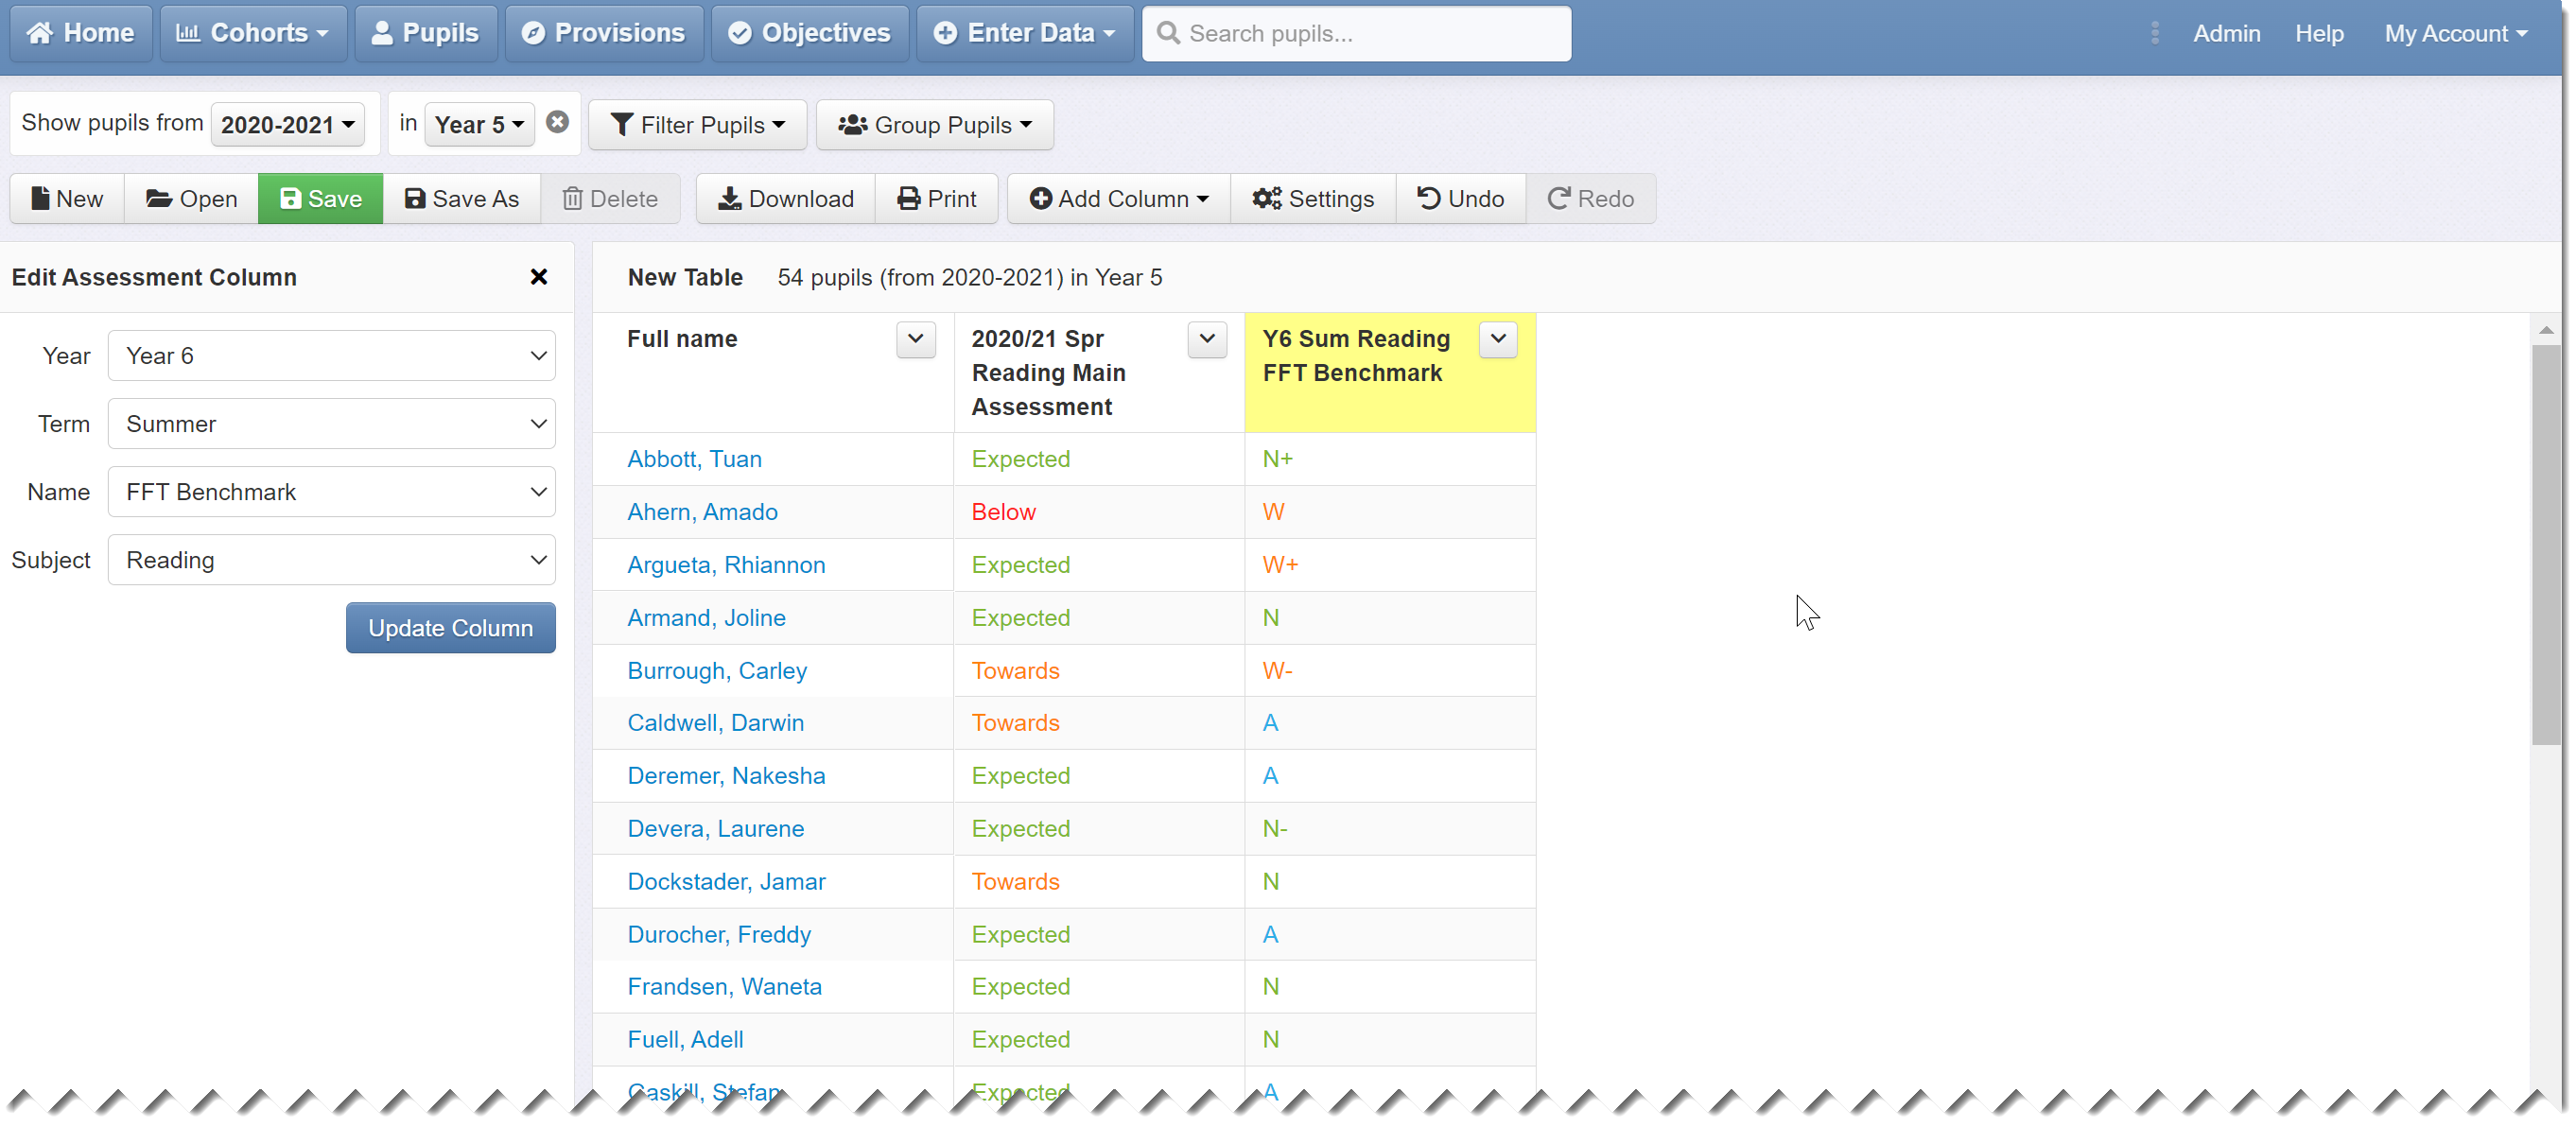
2) Add assessment columns
Click Add Column > Assessment Column to add the assessment data you want to compare. Here, we have added two columns: the first contains the latest main assessments in reading for Year 5, and the second contains imported end of Year 6 FFT benchmarks for the same cohort (i.e. targets they might be expected to reach next year).
3) Add a progress column
Now click Add Column > Progress Column to add a column that will compare the assessments inserted in step 2.
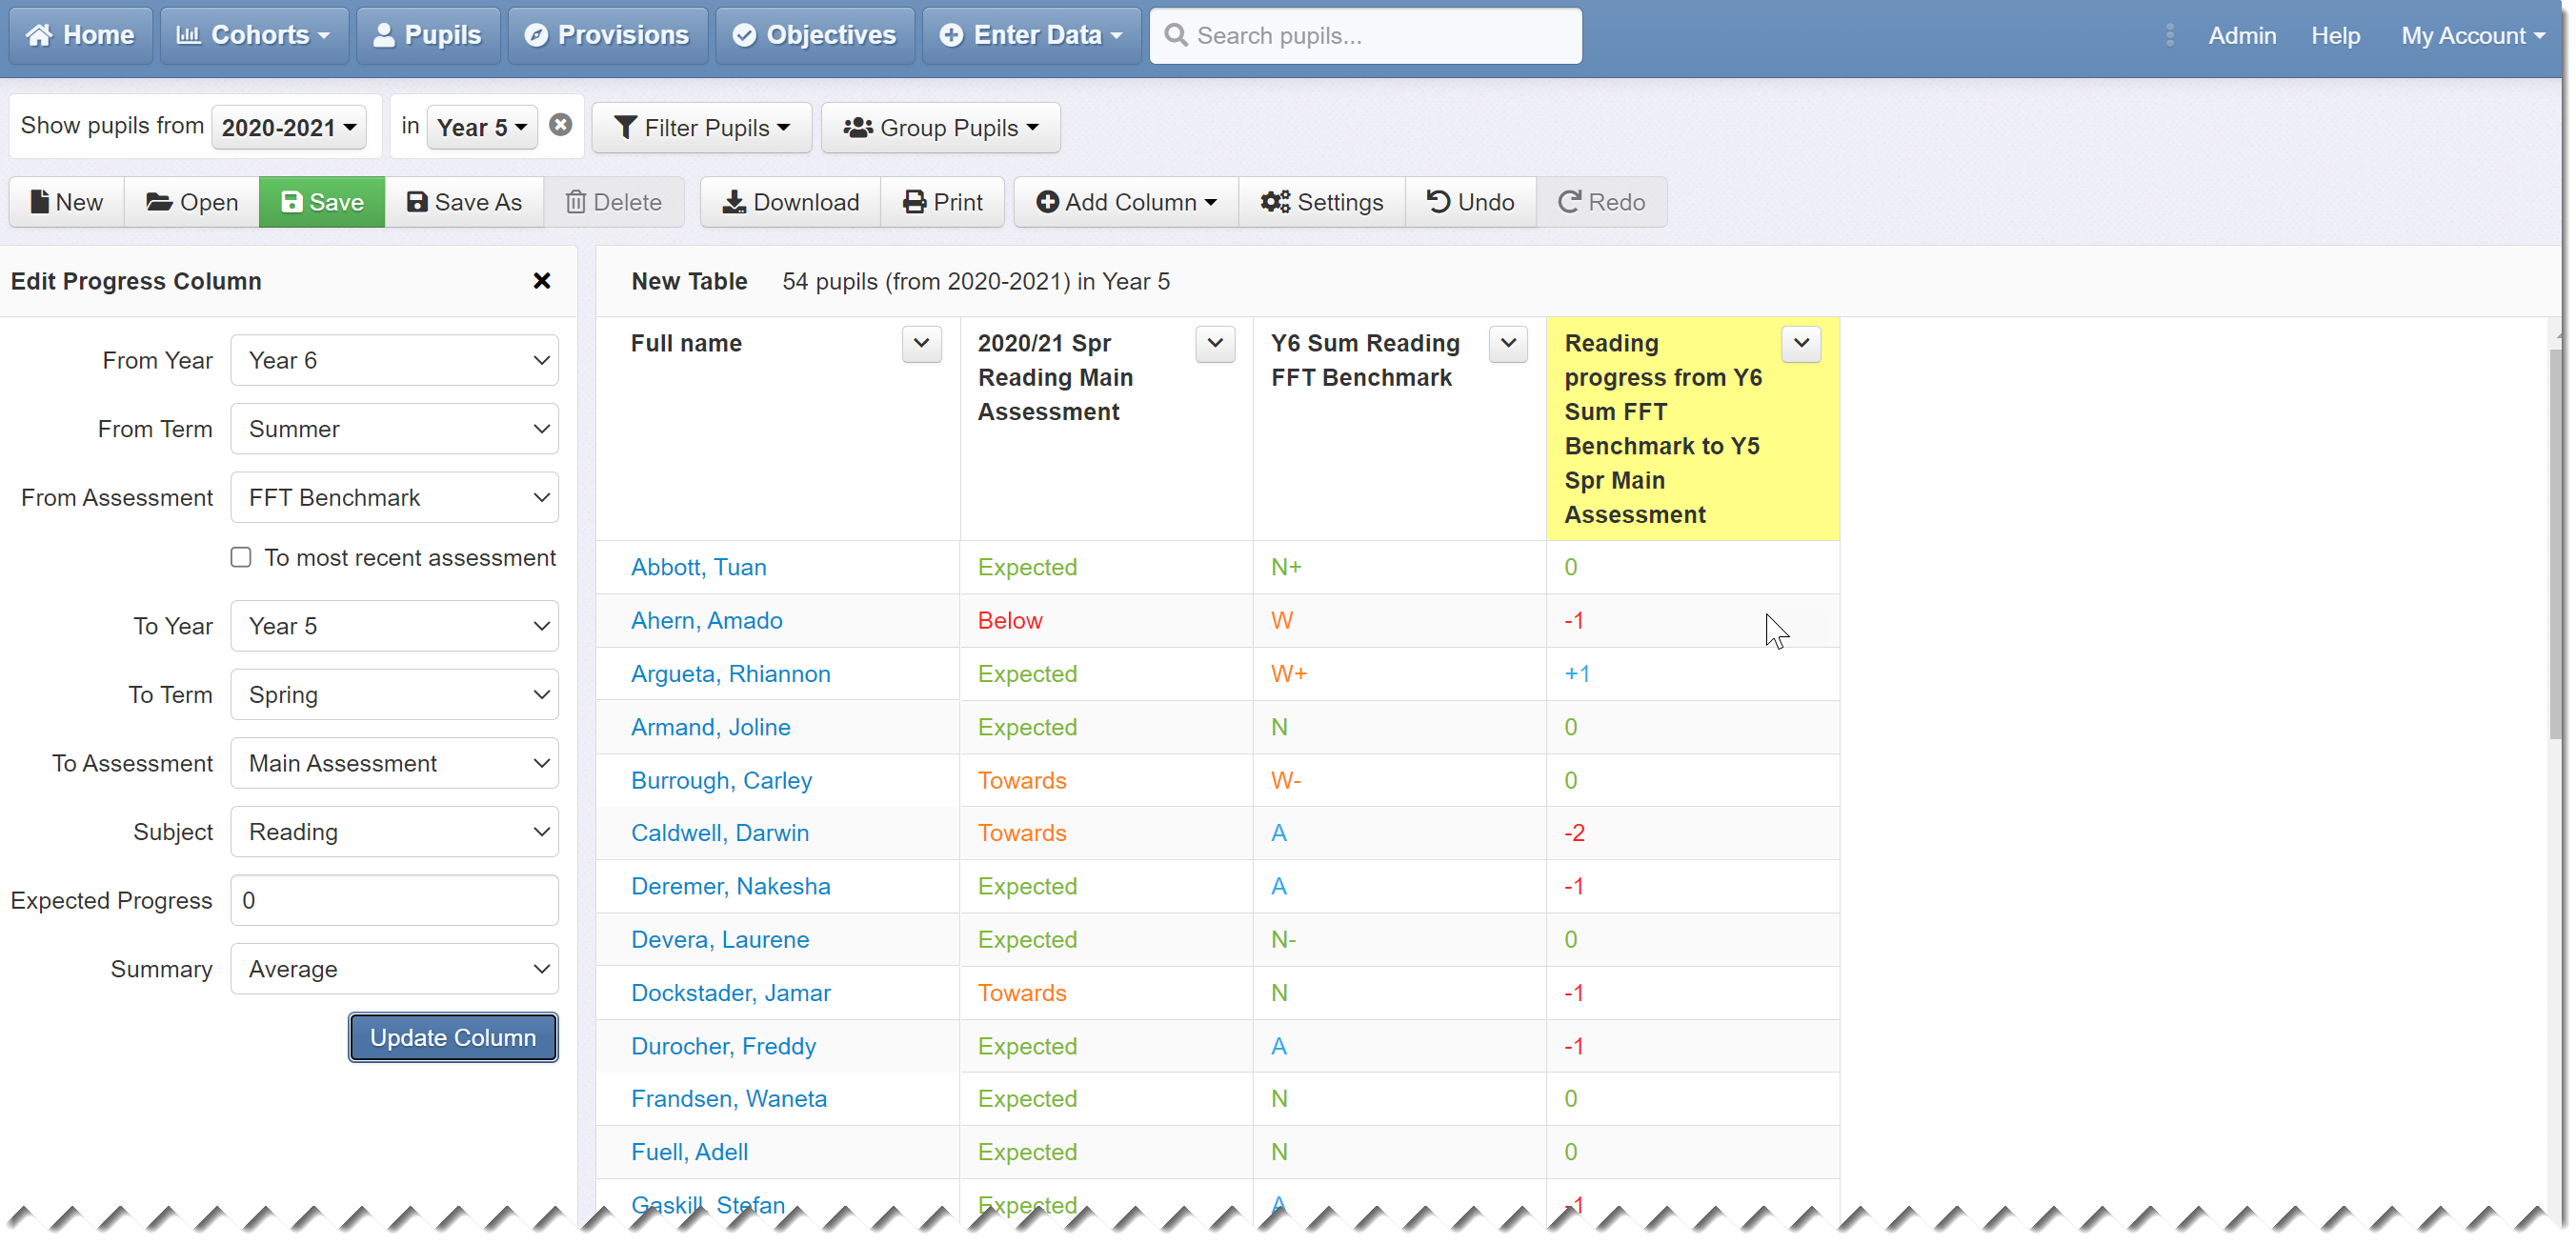
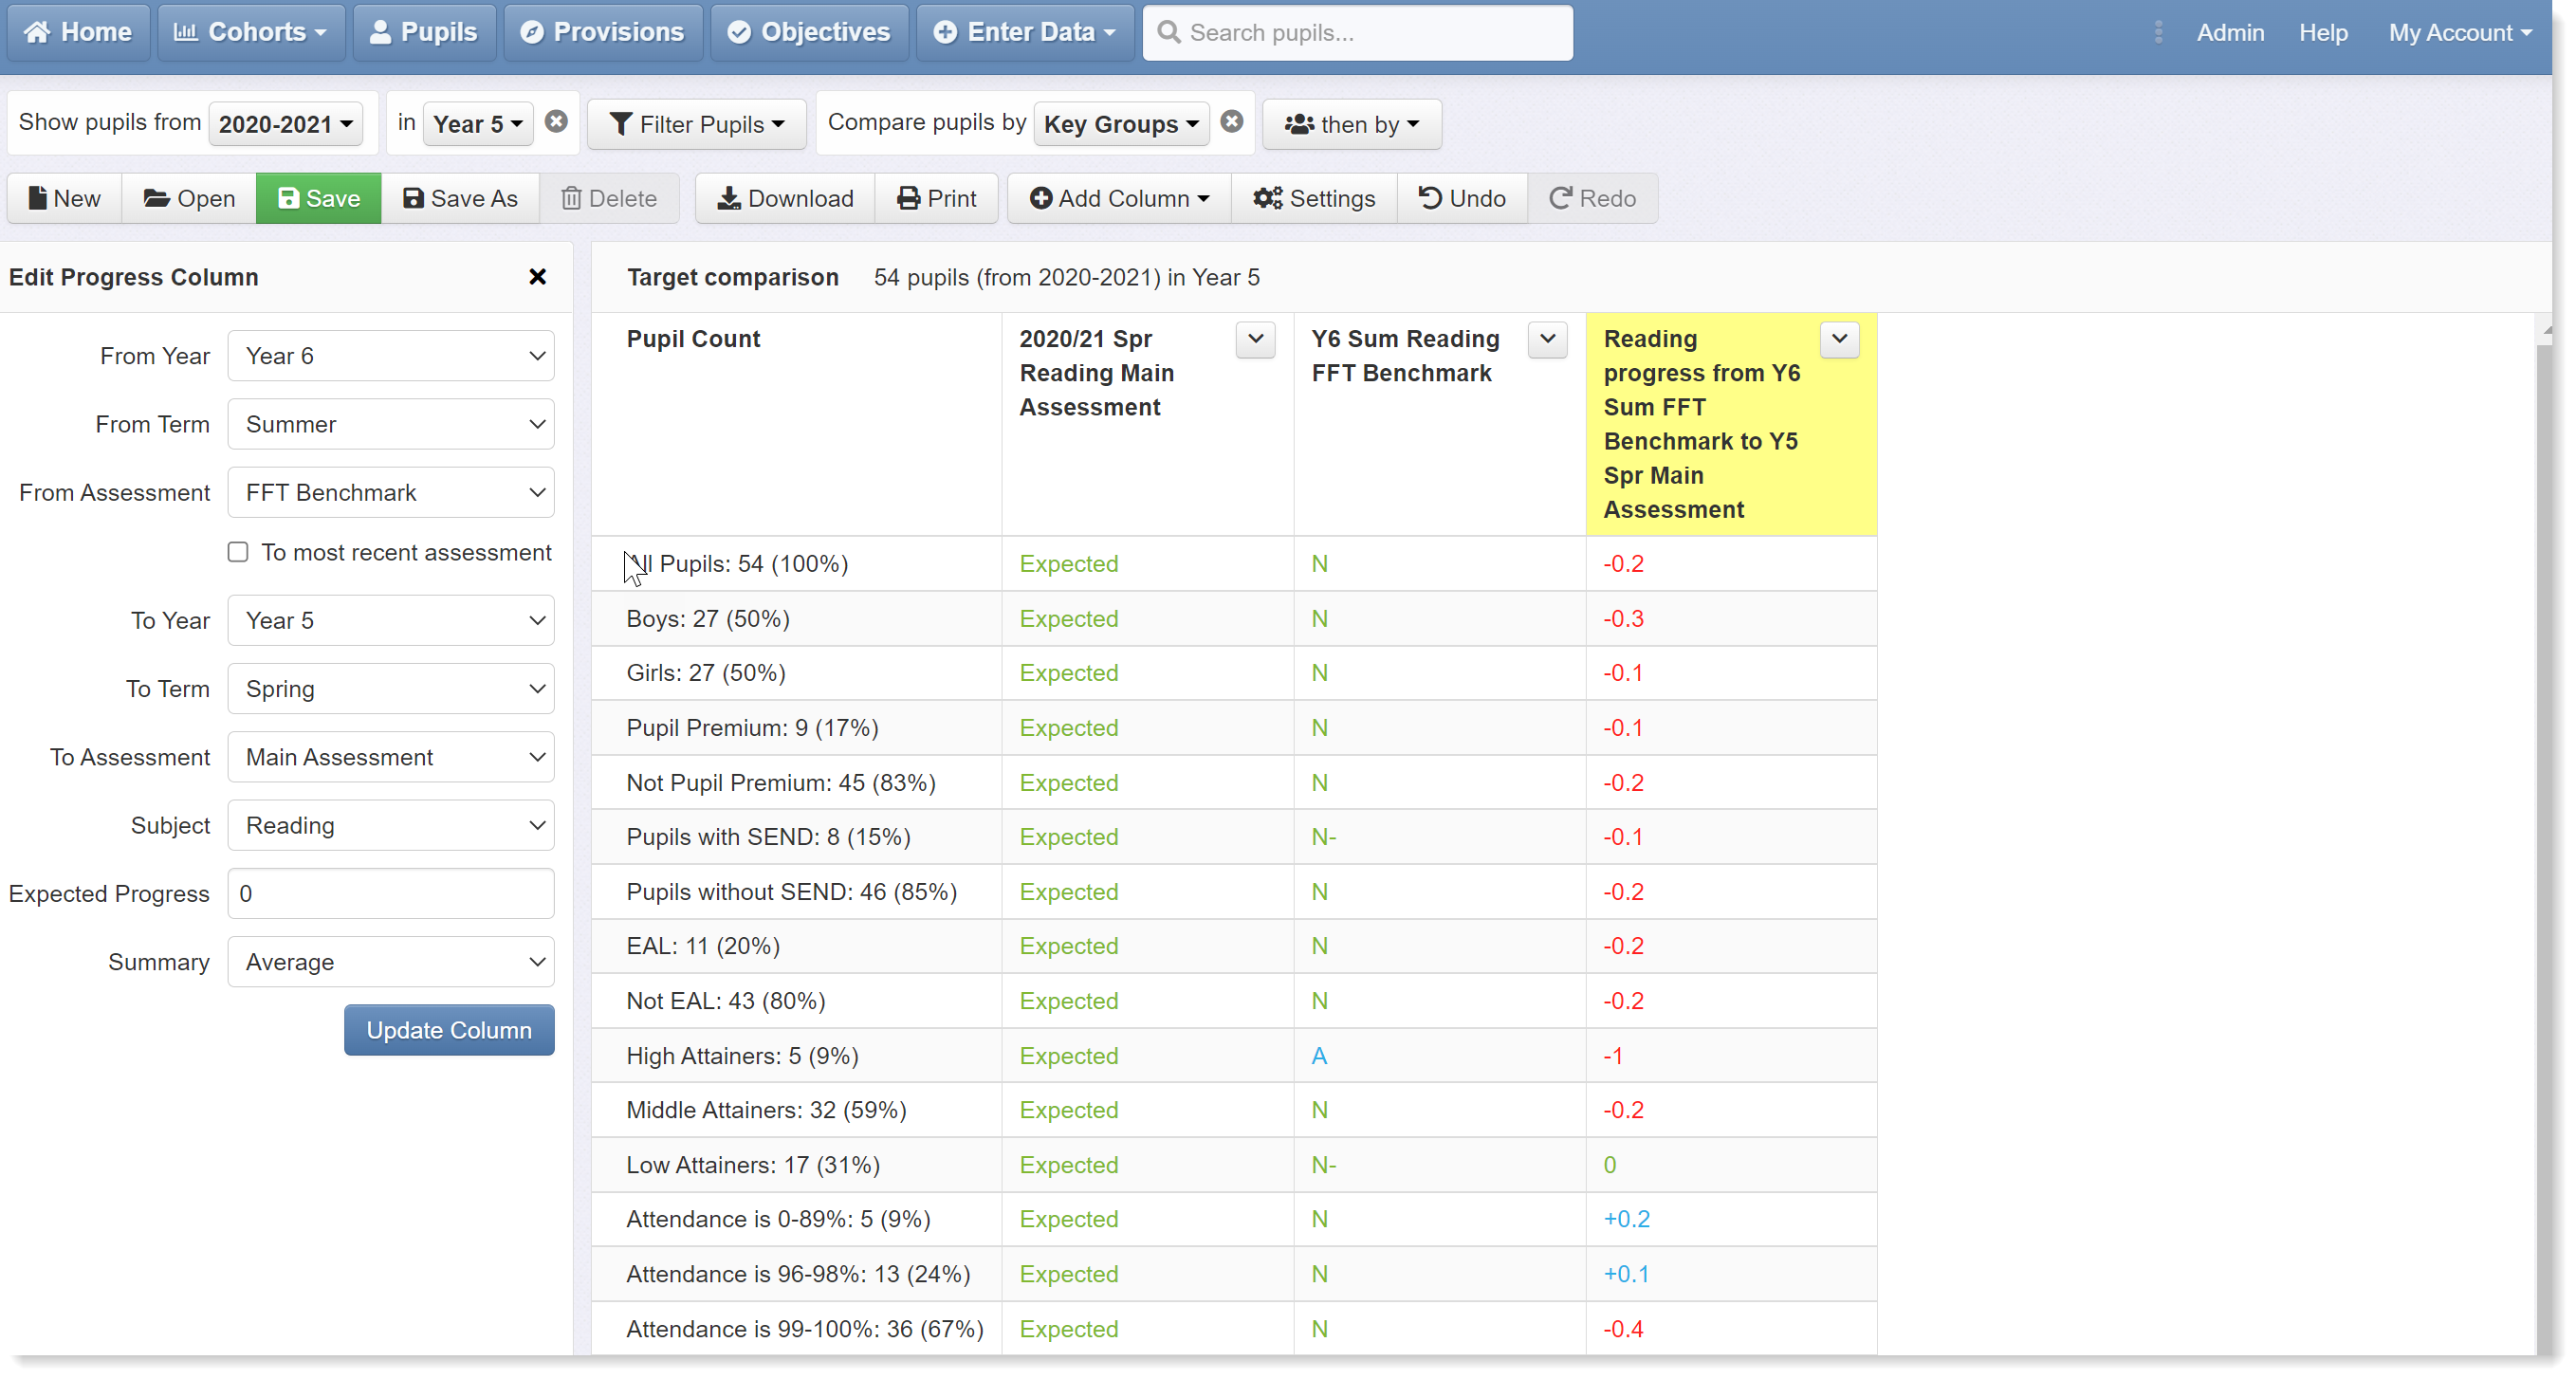
Here, there is an important but perhaps confusing difference to how you might usually set up a progress column in a table. As outlined in the help guide on using progress overviews to monitor targets, you need to select the target first and the recent assessment second in the dropdowns in the left-hand panel (see screenshot above). This will then subtract the target from the assessment rather than the other way round. For example, a pupil that is targeted to be GDS at the end of Y6 but is currently EXS will have a score of -1 in the progress column (i.e. they are one band below target). If we reversed the setup, choosing the assessment first and the target second - which might seem more logical because the assessments are in chronological order - the score would be +1 (i.e. one band above target).
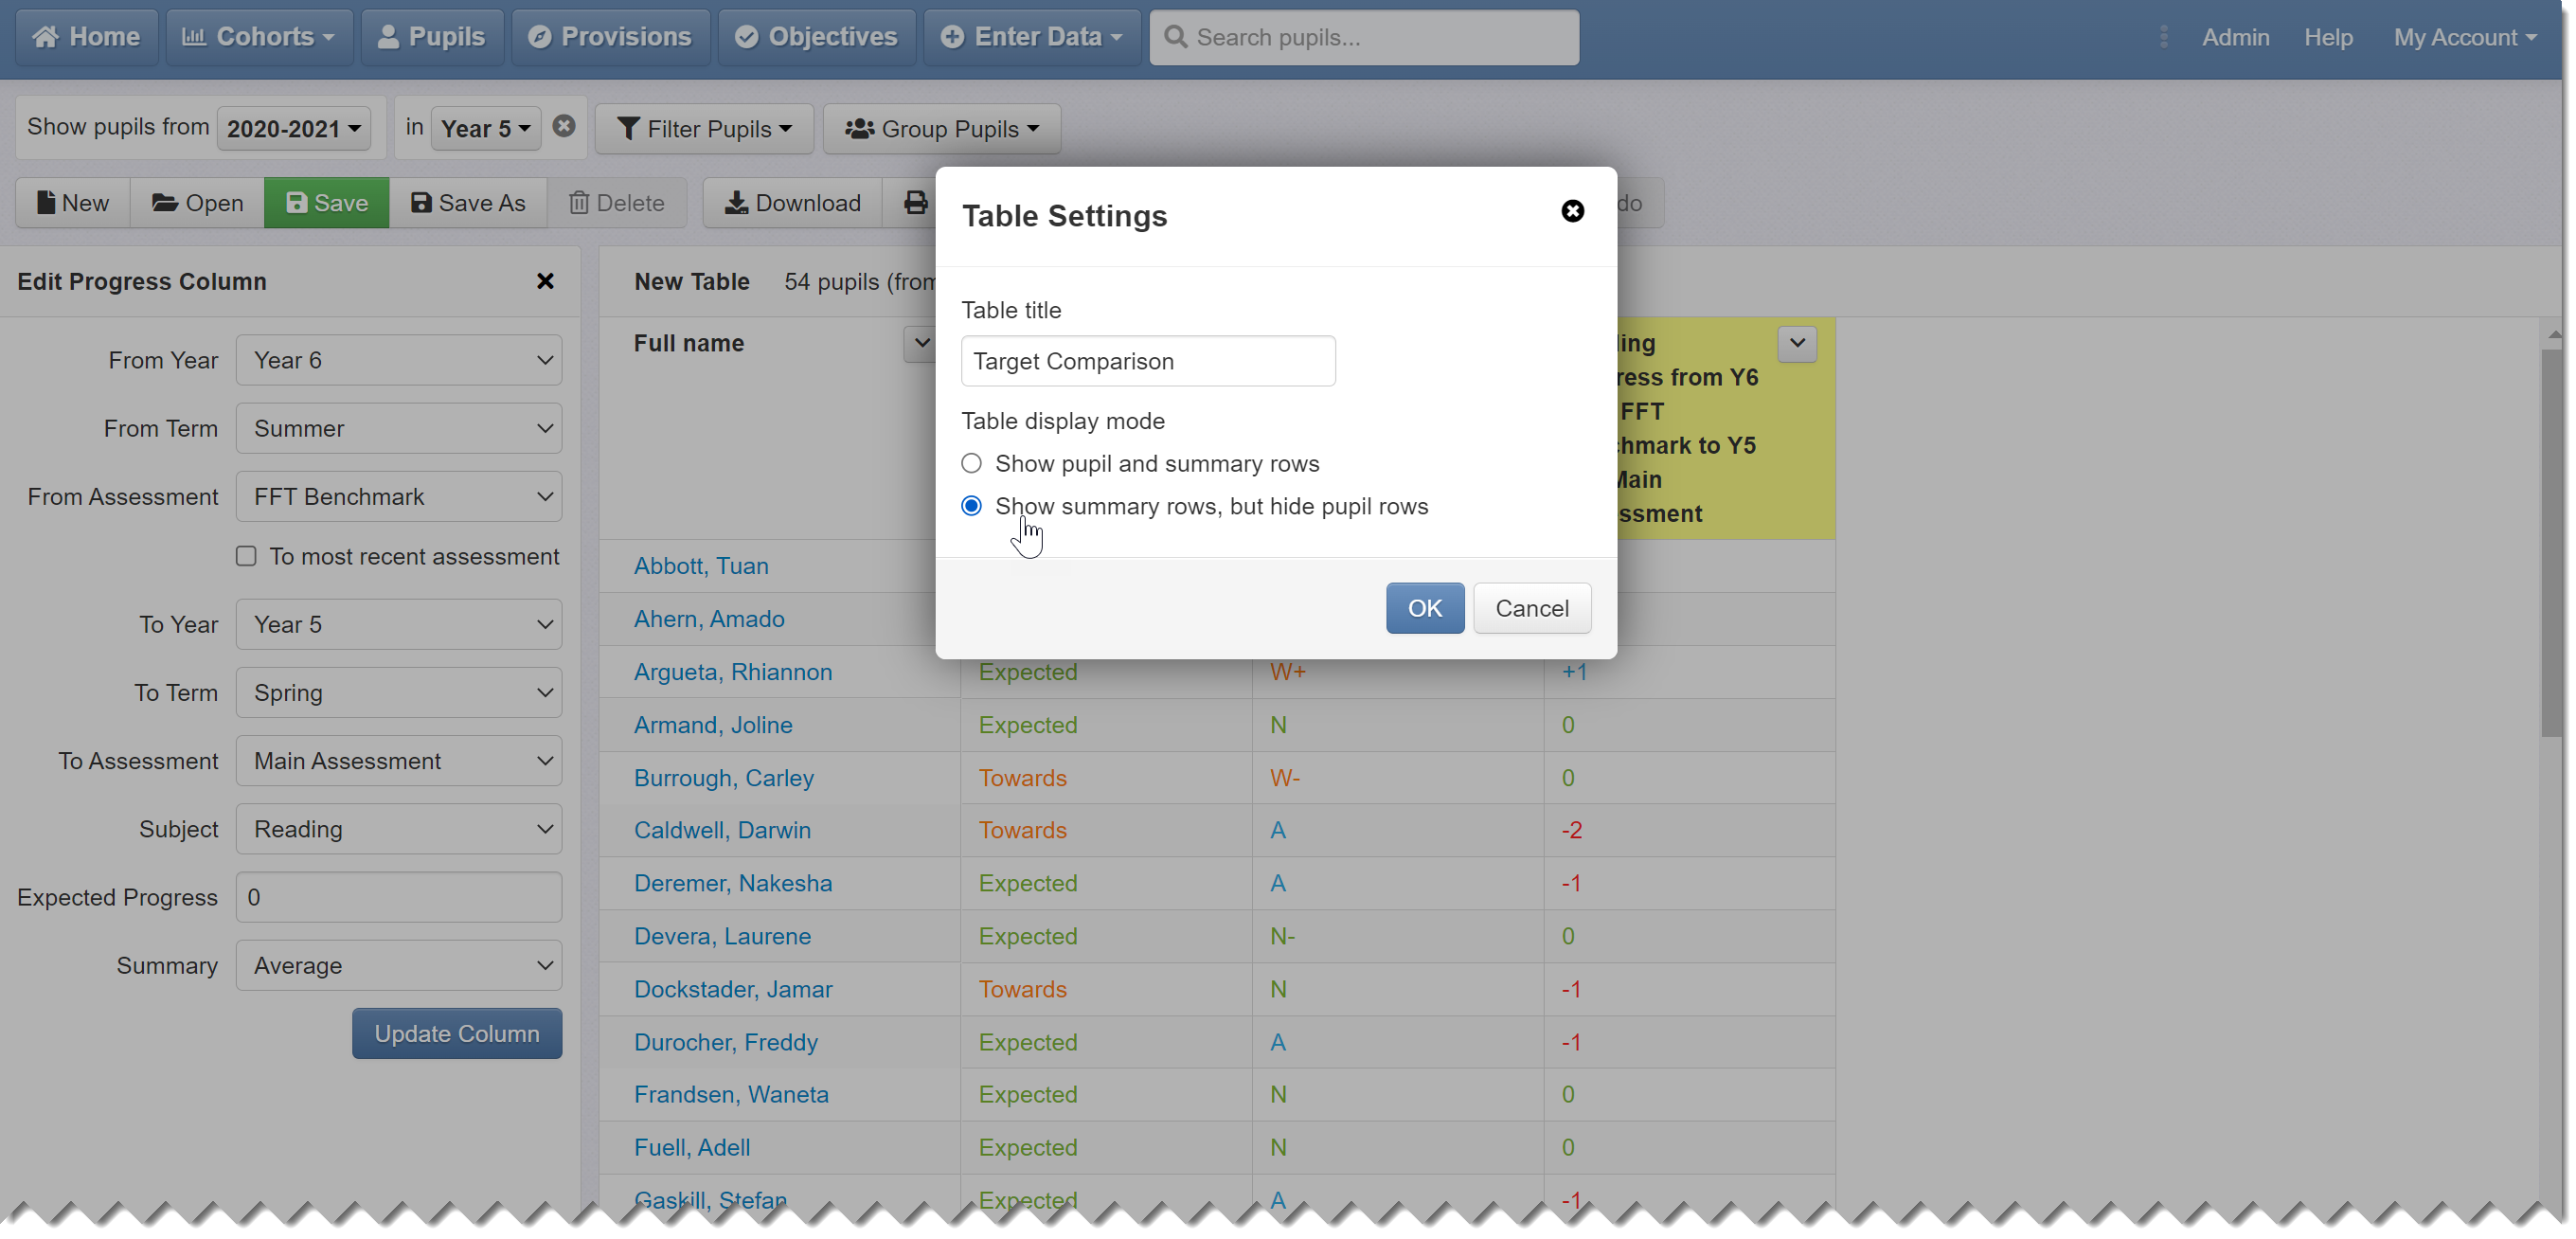
4) Summarise and group the data
This is optional but you might want to do this to report to governors for example.
Click Settings and give your table a name in the Table title box. Then click the 'Show summary rows, but hide pupil rows' button. This will reduce your table to a single row.
Now choose a grouping option by clicking on the Group Pupils button at the top of the screen. Here we have selected the Key Groups option:
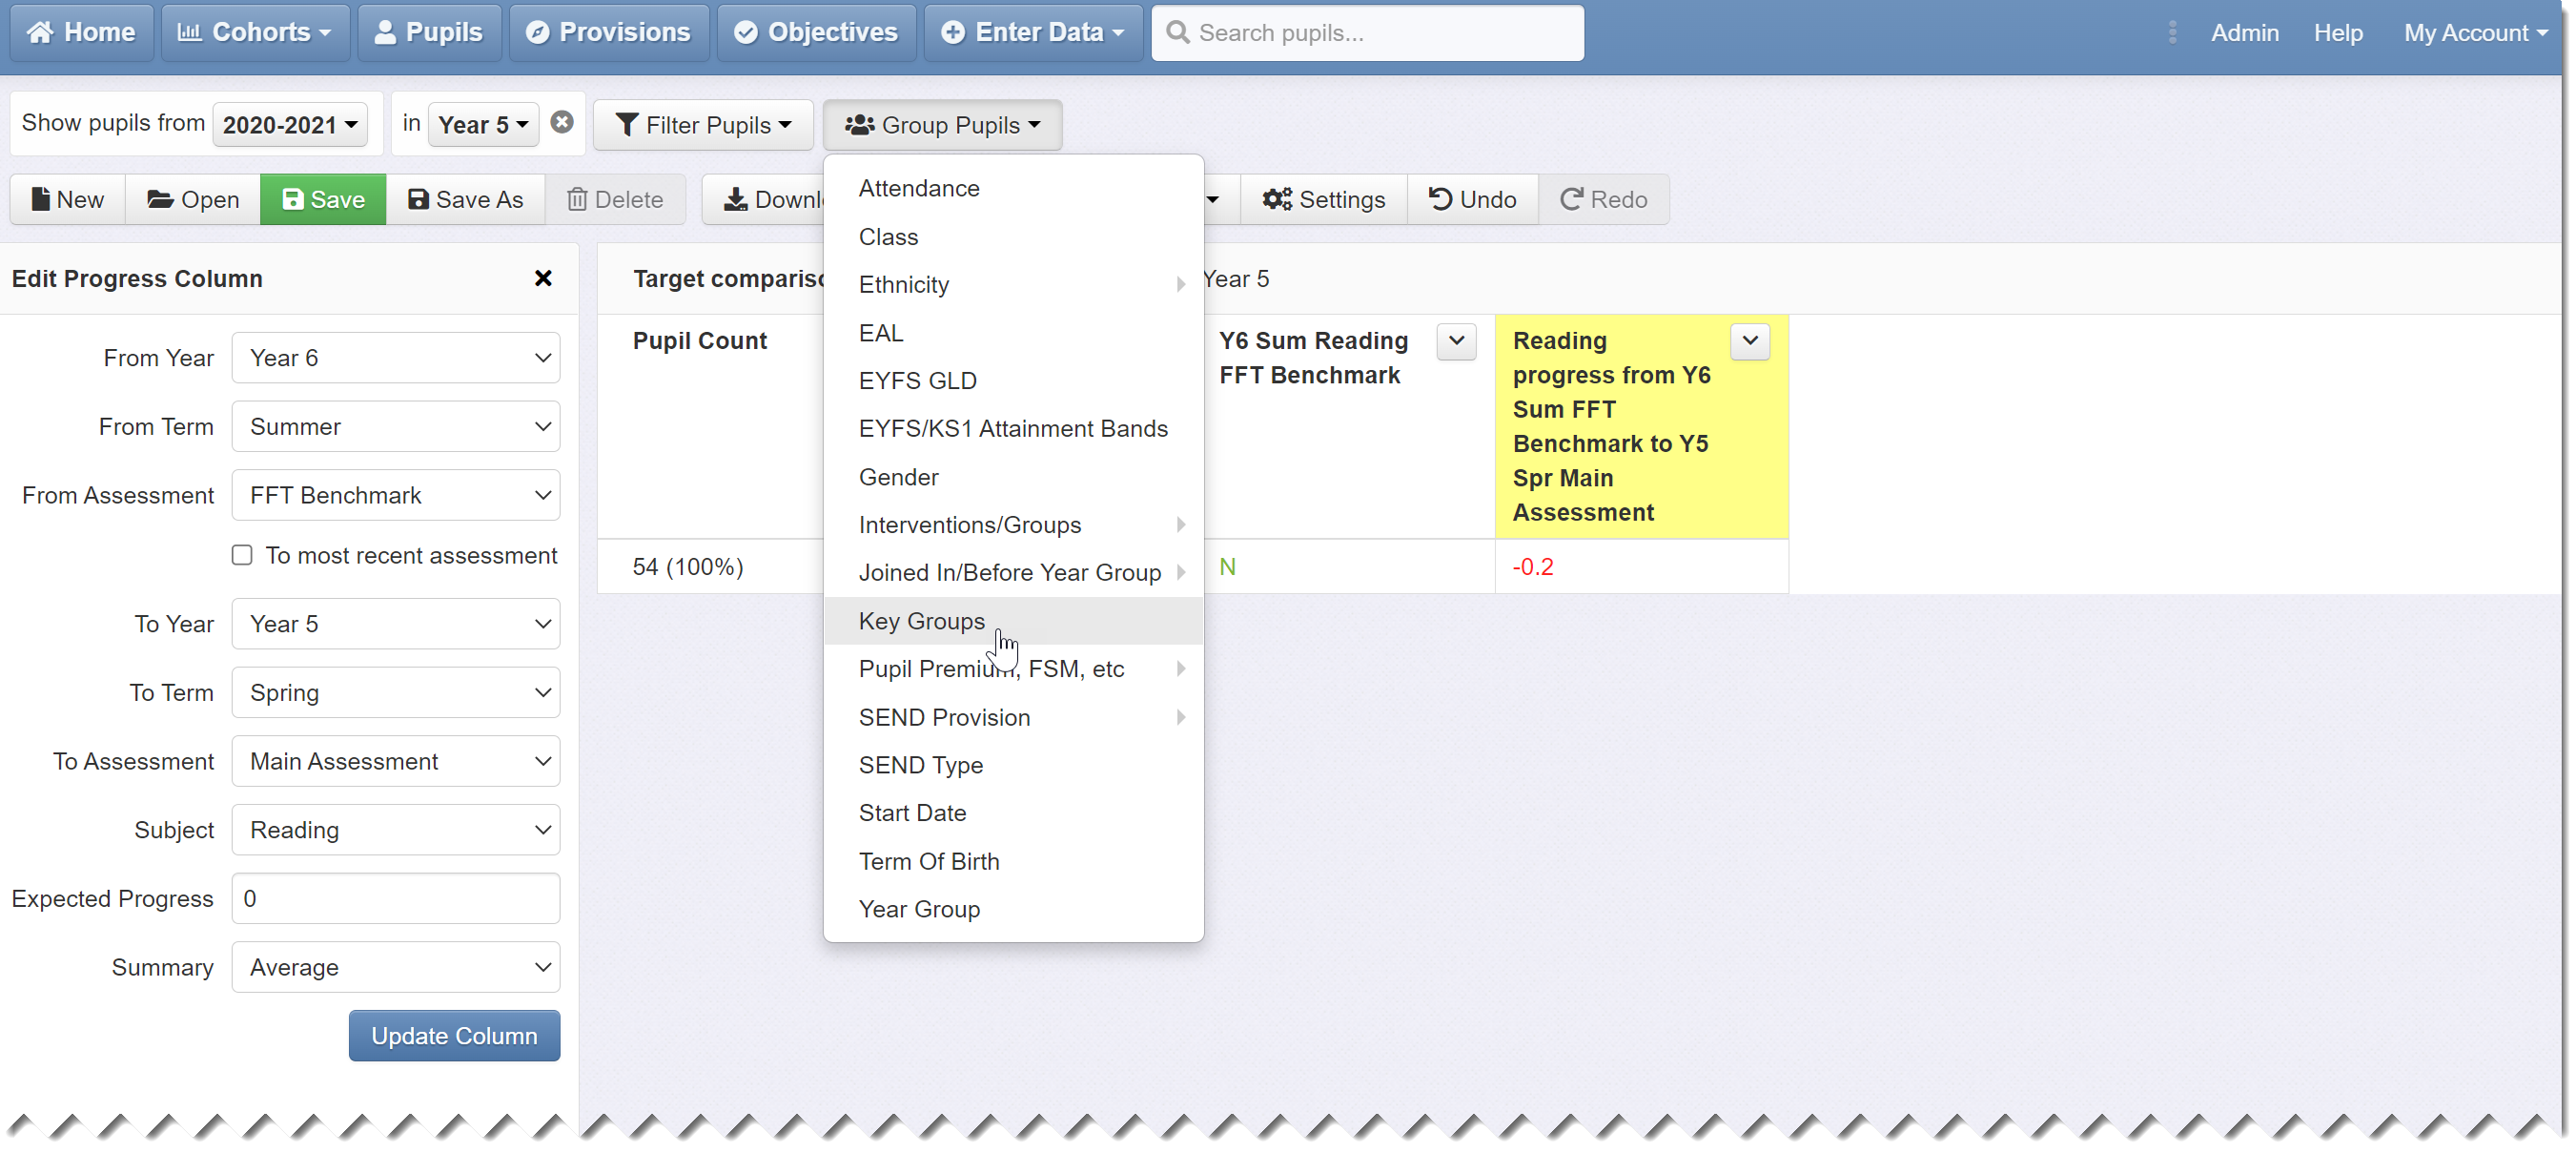
This groups the data by your selected Key Groups and shows averages for each.
We hope this help guide has been useful. Please get in touch if you need any further help.