Ladders report tour
 Updated
Ladders are a great way to see the progress of a cohort across the year and quickly spot fluctuations in attainment. The report includes a way of colour-coding pupils according to their characteristics, to help see patterns and trends.
This guide will walk through some examples to show how to:
- Use the report controls to view different types of data;
- Apply pupil groupings to see patterns and trends.
We've also included some tips to help you get the most out of the report.
Using Ladders in Insight
Click on the Reports menu and select Ladders.
Before you can view the report, you need to filter to a single year group.
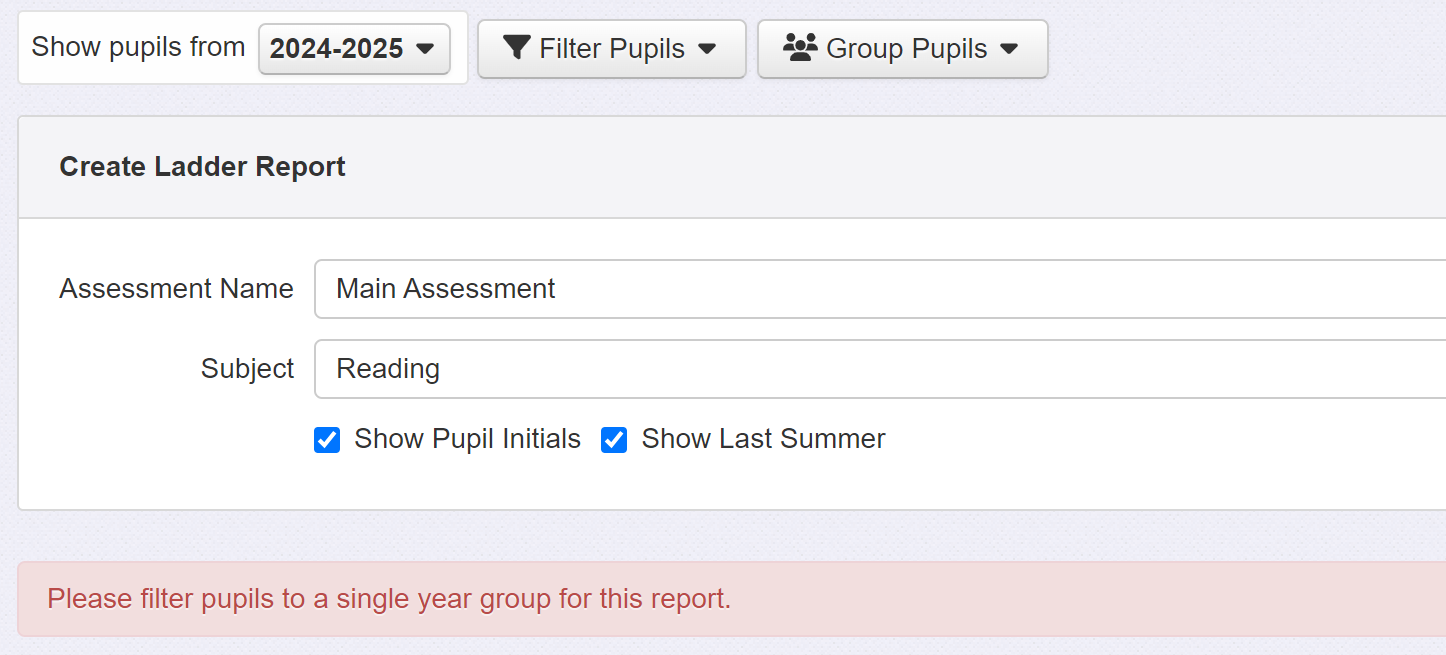
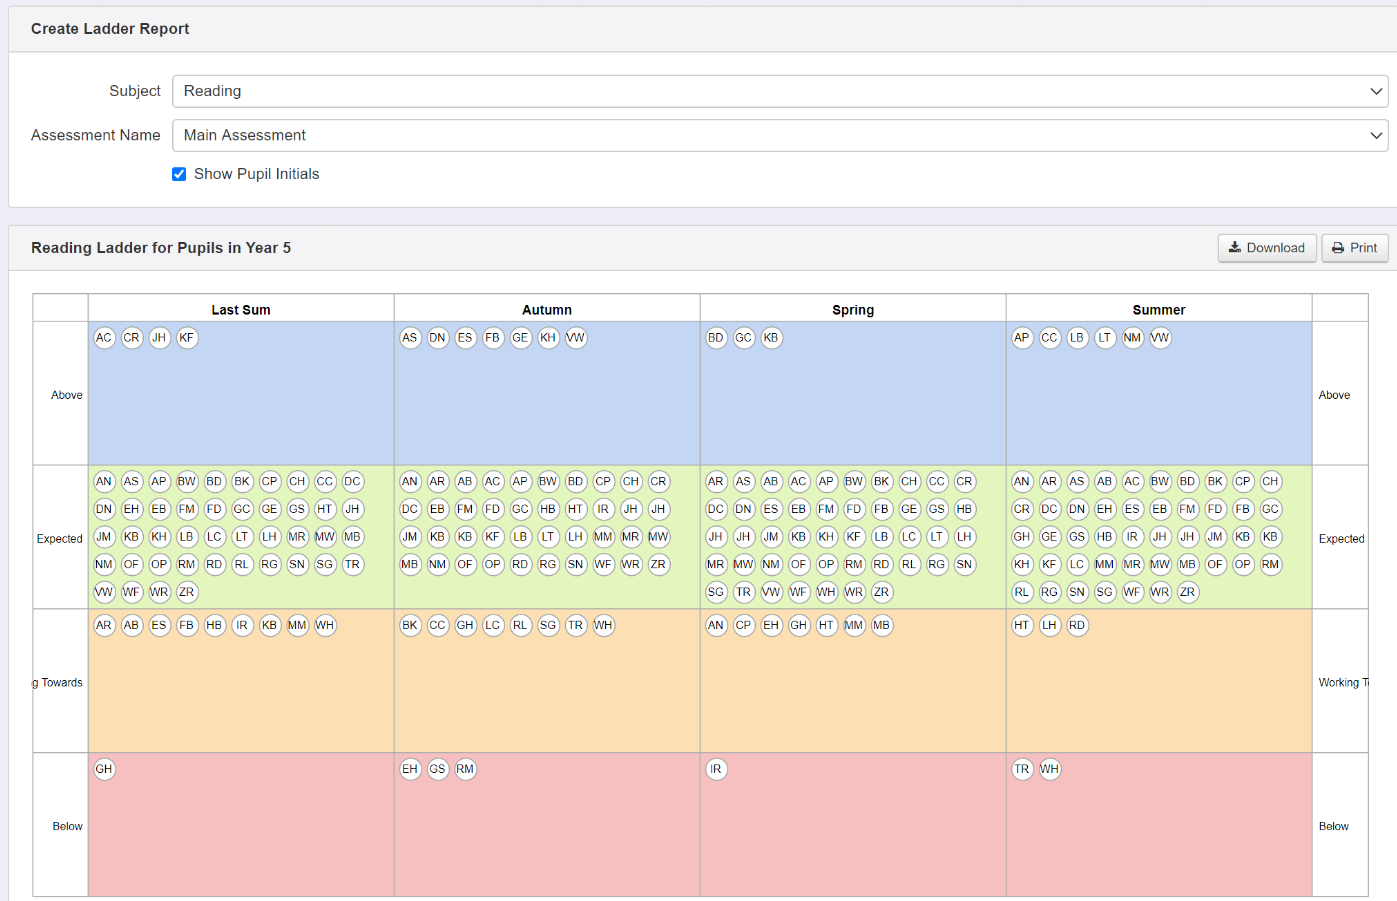
A default report is generated showing the change in Main Assessment data in Reading across the current year, for whichever cohort you have investigated most recently. We're looking at Year 5:
The Basics
The report groups pupils by their assessment result in a single subject for each term. Each pupil is presented as a circle, either containing their initials or a number, depending on the report settings and your access level.
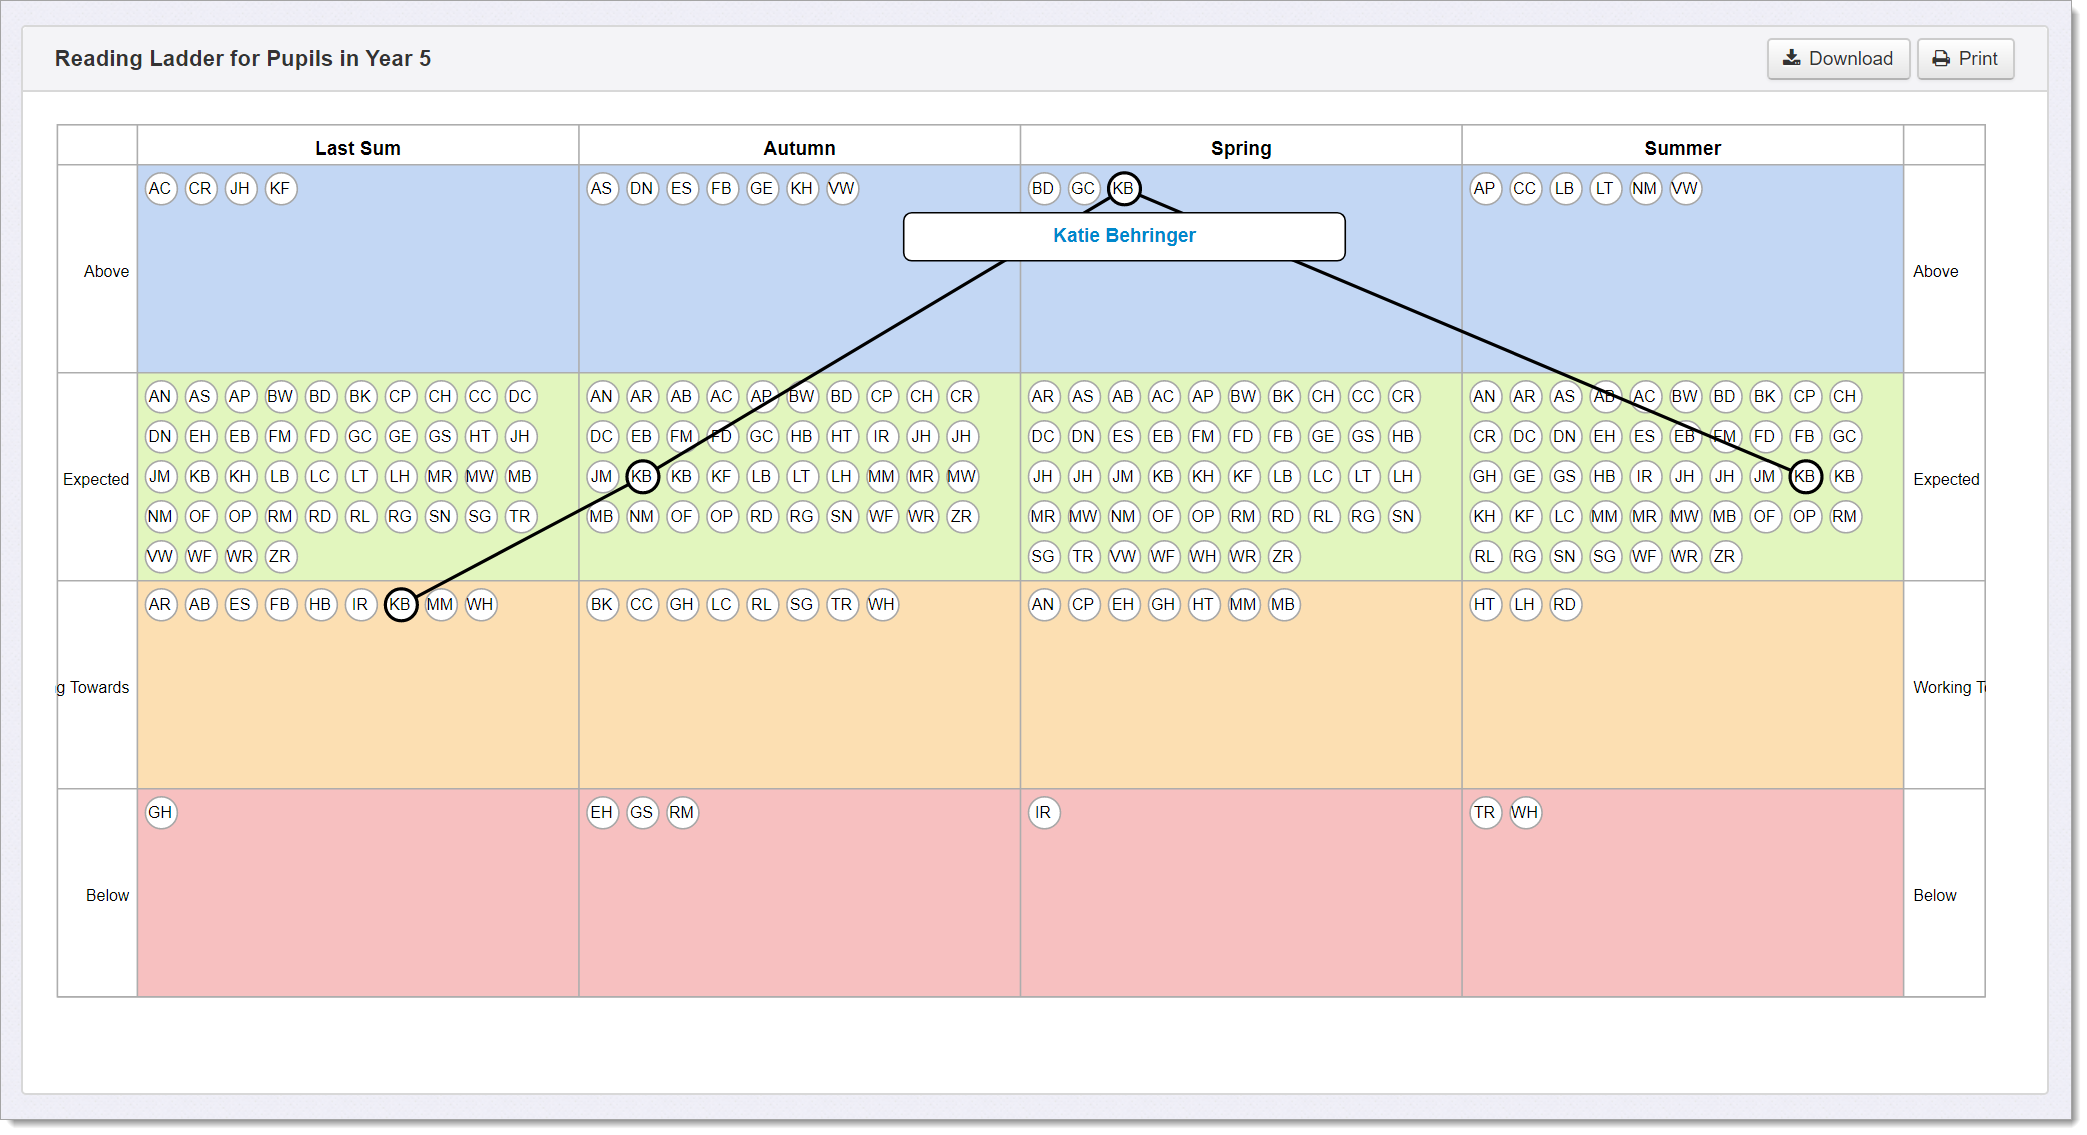
By clicking on any circle, we can join the dots to show that pupil's journey across the year.
The terminology, cell colouring and number of rows you see will reflect your school's chosen assessment language for the data you're looking at. In our example below, we see that Katie was 'Working Towards' expectations at the end of last year, was assessed as working 'Above' expectations in the Spring and ended the year at 'Expected':
Using other types of assessment
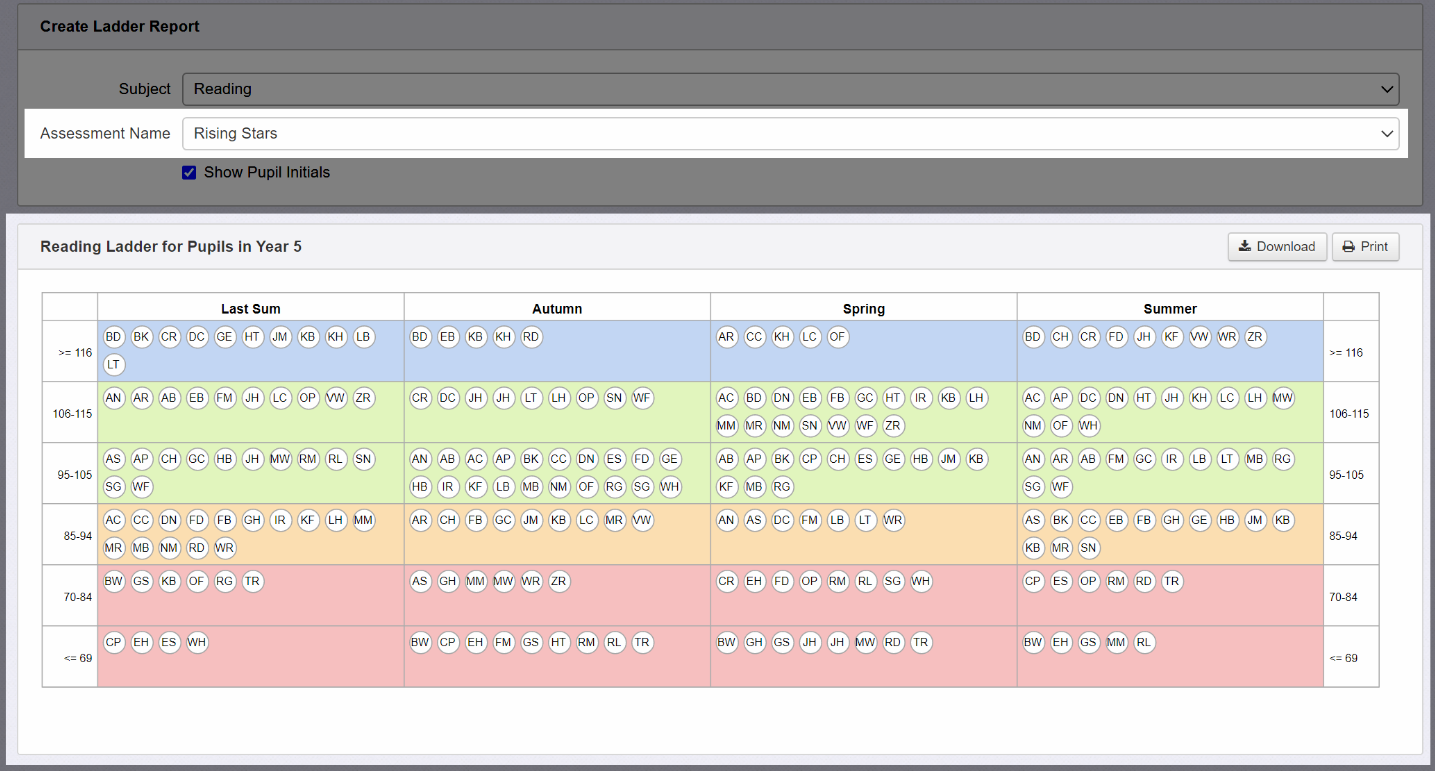
As with other reports, we're not restricted to looking at the 'Main Assessment'; we can use other types of data, too. In the following example, we've changed the Assessment Name option to 'Rising Stars' (a standardised test). This now groups pupils according to their test scores:
Grouping pupils by their characteristics
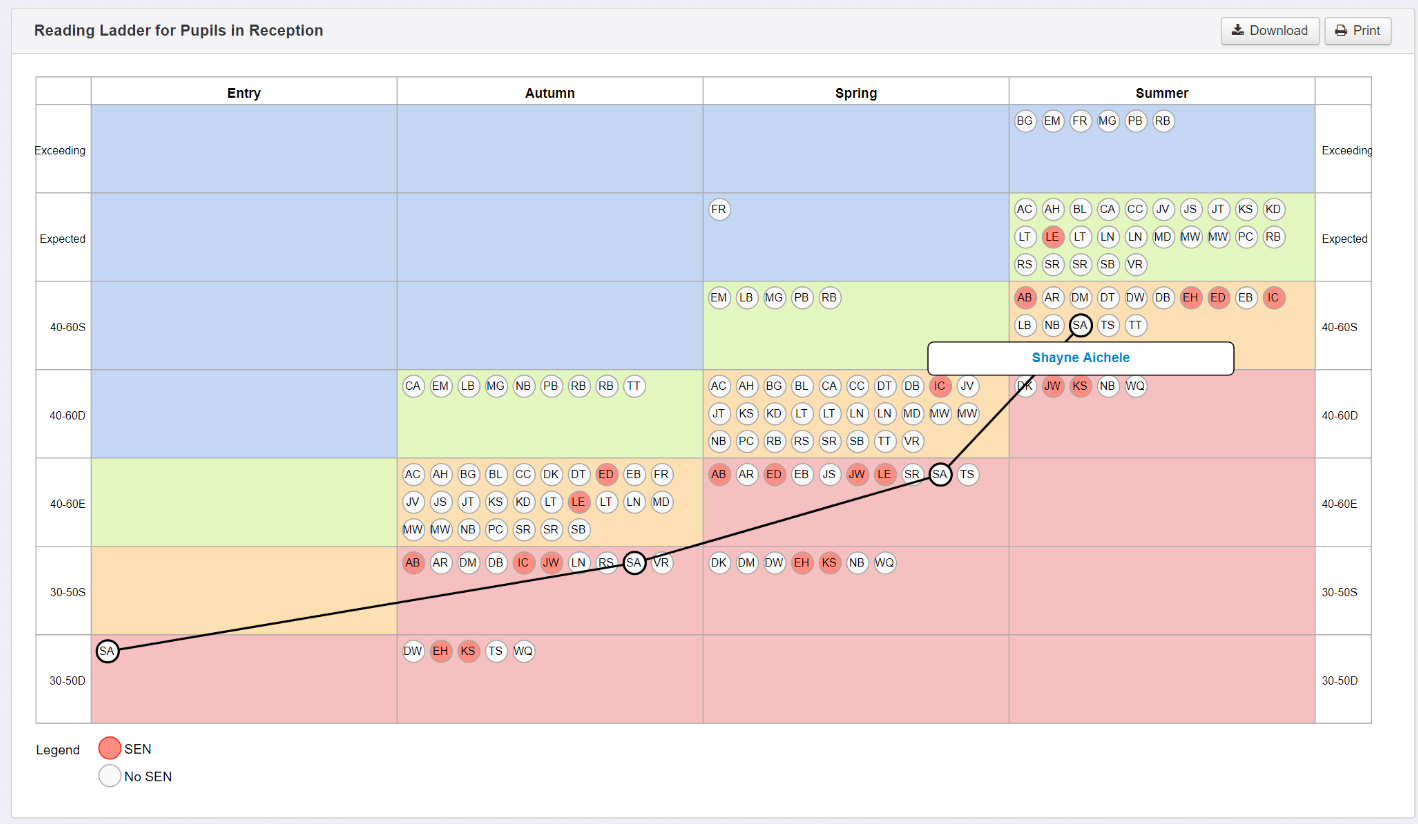
The main purpose of the report is to group pupils by their attainment over time, but you can also group them by their characteristics. To do this, simply click on the Group Pupils button and select an option to colour code pupils on the basis of your selection:
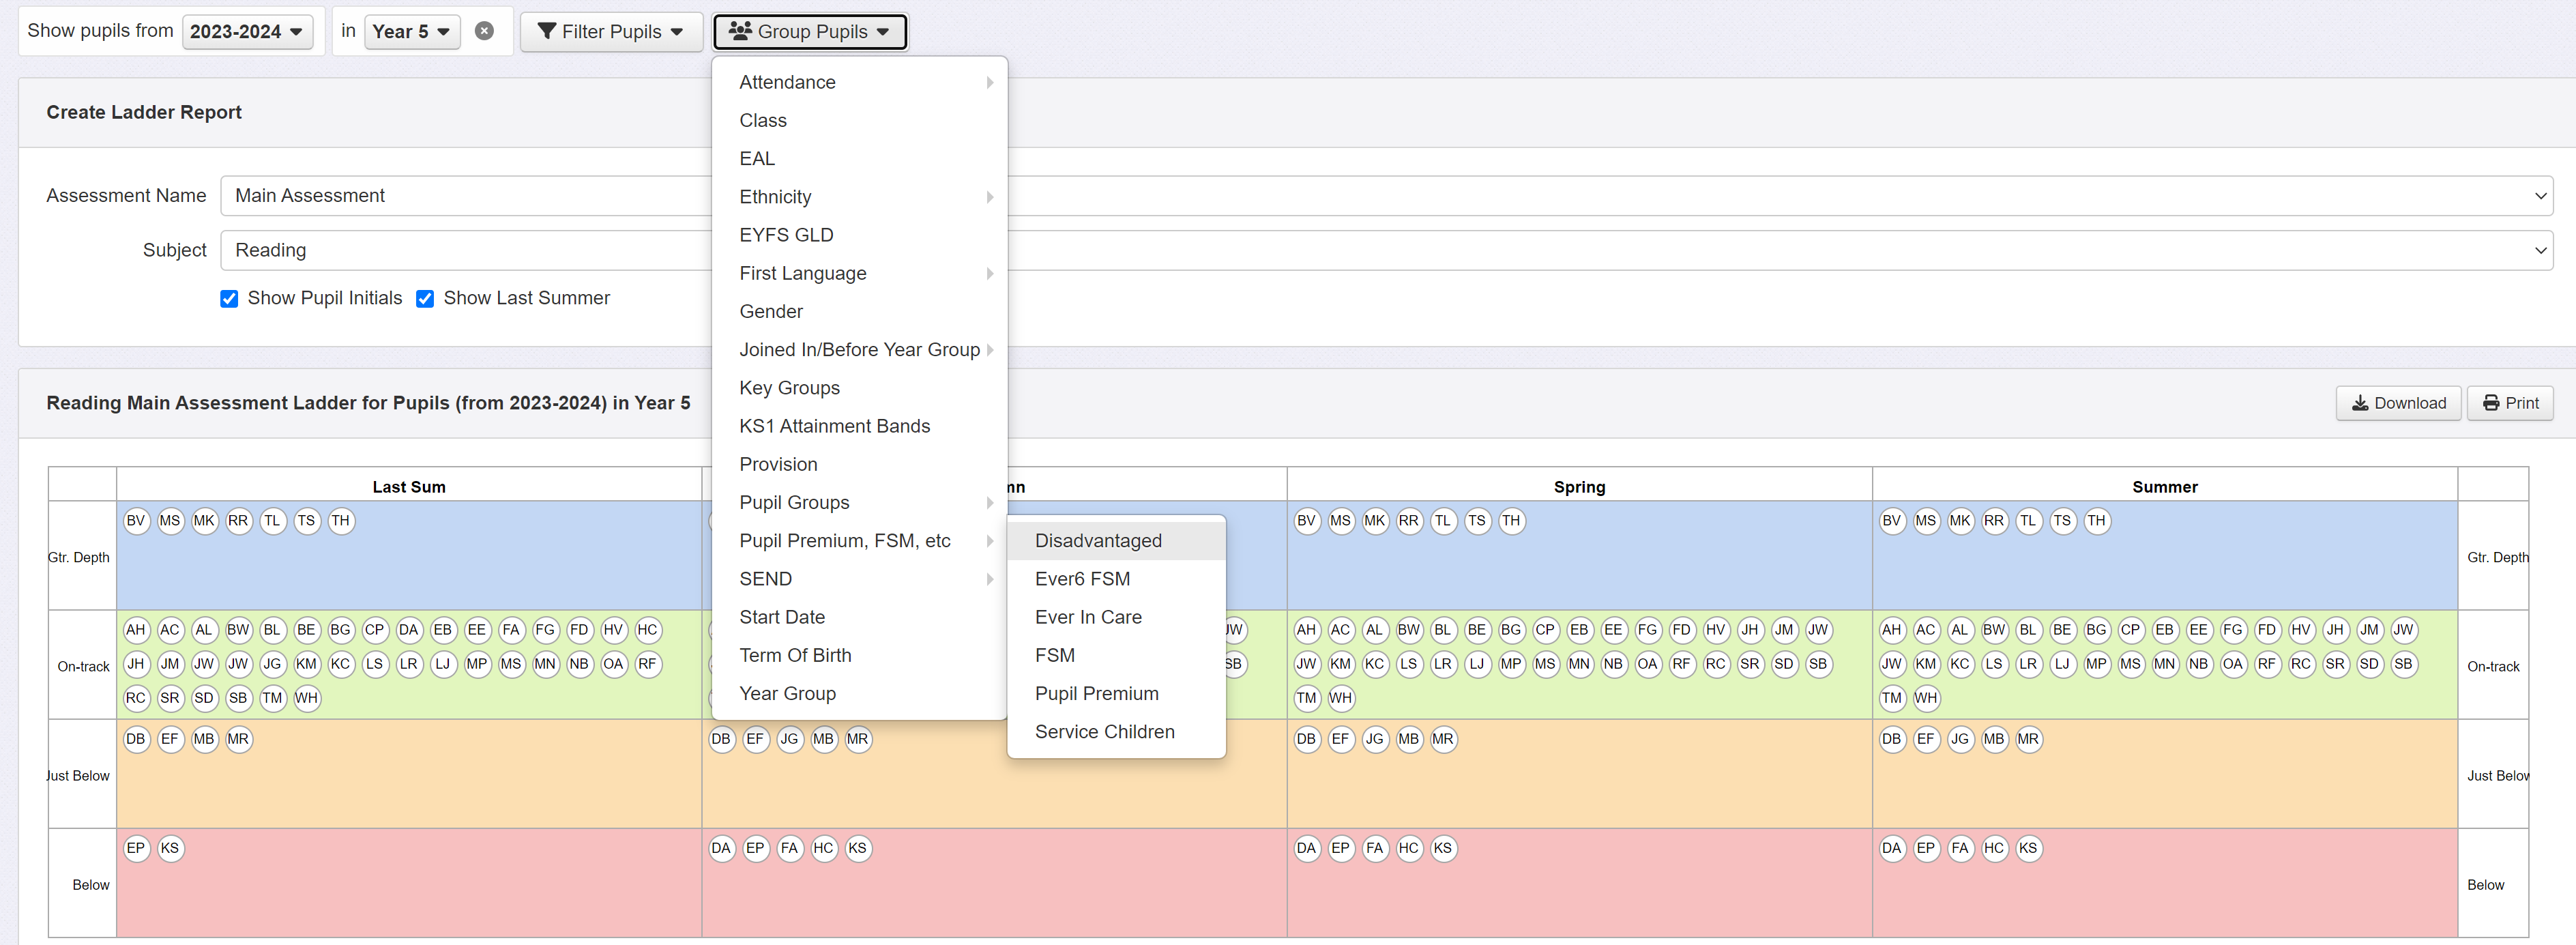
In this case we have selected Disadvantaged from the Pupil Premium, FSM etc sub menu. Here's the result:
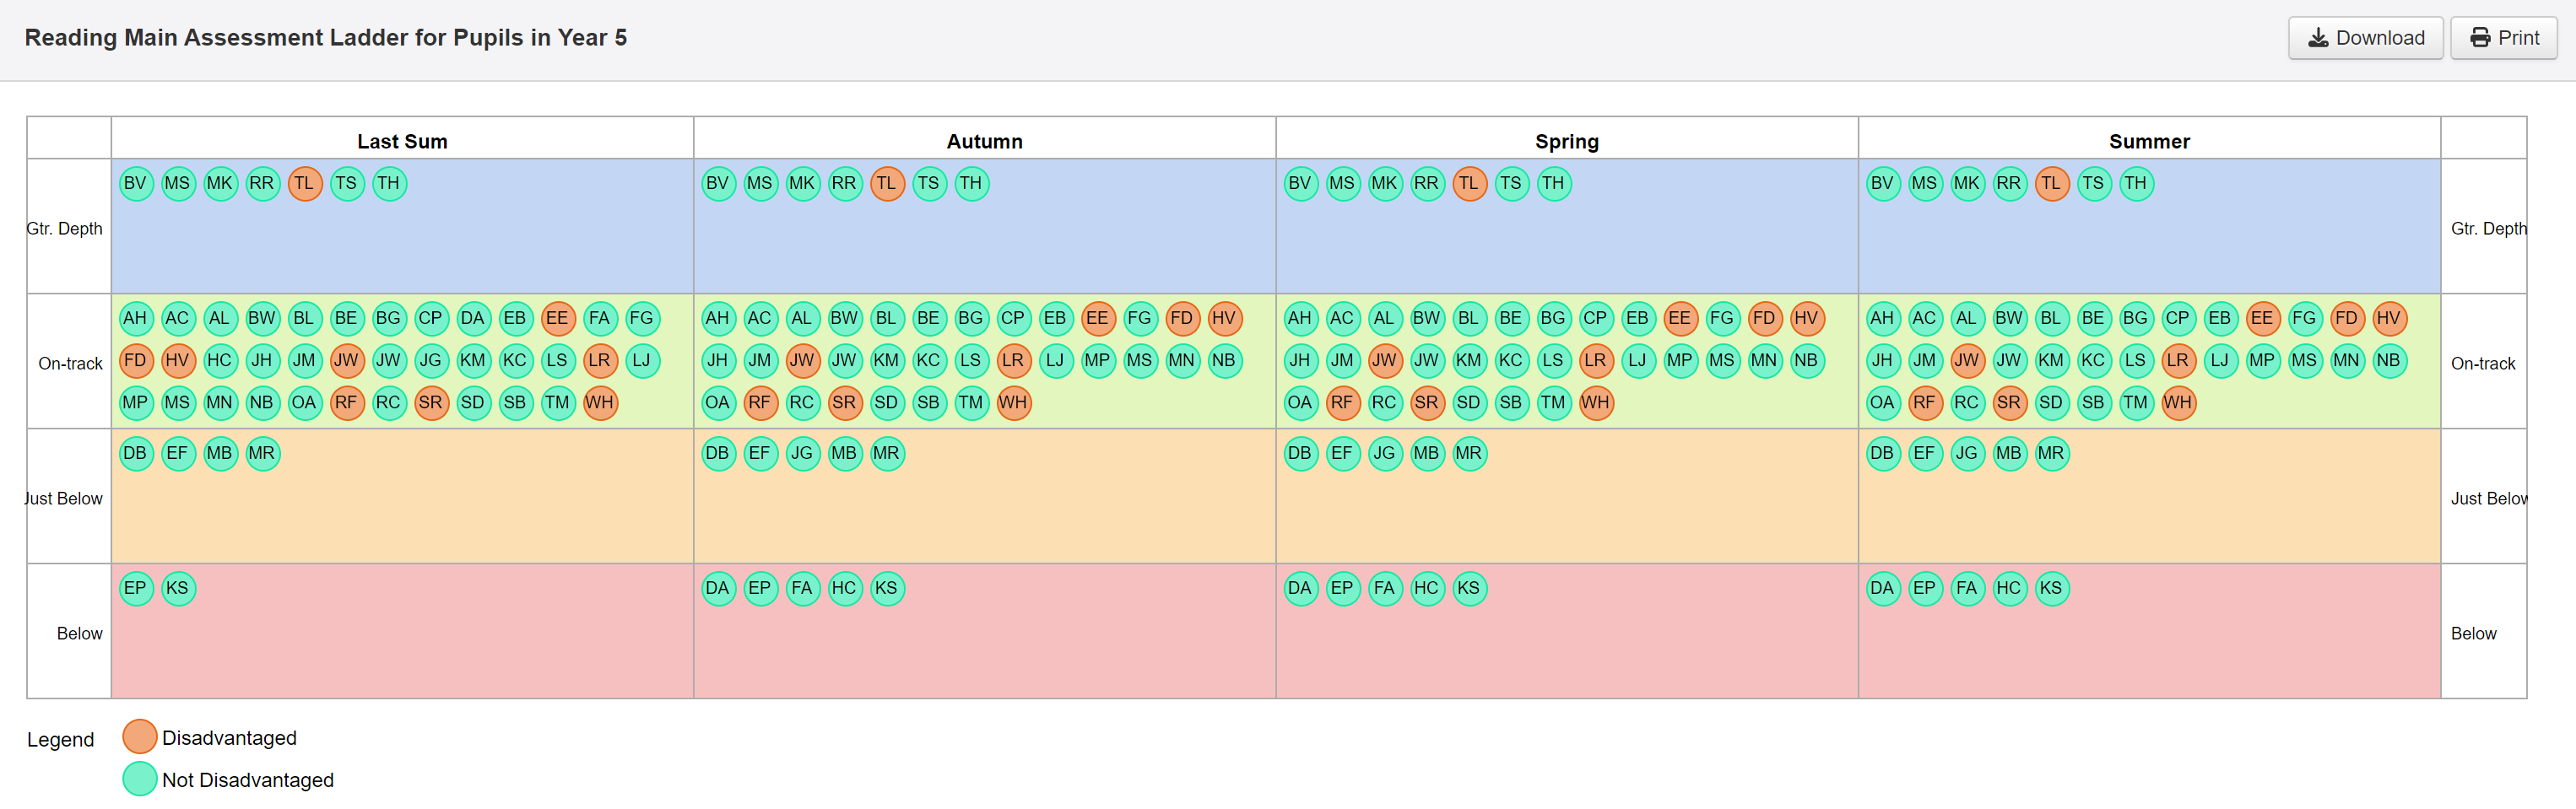
Disadvantaged pupils are easily identified by red dots (note the legend below the Ladder).
And finally… Download and Print
You can save the report as an image file or print it using the Download and Print buttons to the top right of the Ladder. You can save the report in PDF format by clicking the Print button and using your web browser's 'Print to PDF' or 'Save as PDF' option.