Identifying pupils in the lowest 20%
 Updated
Ofsted has been using quintiles as a way of categorising data for many years and is currently prioritising the achievement of pupils in the lowest 20% during inspection. Unfortunately, what constitutes 'the lowest 20%' has not been clearly defined and - quite understandably - this is causing some anxiety in schools.
The Ofsted handbook (paragraph 334) states:
'[Inspectors] will pay particular attention to pupils who are reading below age-related expectations (the lowest 20%) to assess how well the school is teaching phonics and supporting all children to become confident, fluent readers.'
So, how do we define 'the lowest 20%'? And what data can we use to identify the pupils concerned?
First, as the Ofsted Handbook suggests, we should be focused on pupils whose attainment falls into the lowest 20% nationally (those below age-related expectations) rather than those whose attainment places them in the lowest 20% of the school. These are very different things. The 'ability' of each school's lower quintile can vary enormously - think grammar school vs secondary modern, for example.
And, of course, taking the former definition, one school may have just a handful of pupils whose attainment places them in the lowest 20% nationally, whereas in another it may be more than half of the school population.
Having decided that we need to identify pupils whose attainment falls into the lowest national quintile, what data can we use to identify pupils? There is a range of options.
EYFSP
In 2024, 76.5% of pupils met the early learning goal (ELG) in word reading. Pupils that did not meet the ELG are therefore in the lowest 23.5% nationally, and an 'emerging' outcome can be used as a proxy for the lowest 20% nationally.
Phonics
In 2024, 80% of pupils achieved the expected standard in the phonics check in year 1. Pupils that did not meet the standard are therefore in the lowest 20% nationally. There will also be pupils that achieved an exact score of 32 that may be considered borderline and could therefore be included in this group.
Key Stage 1
In 2024, 71% of pupils with data recorded in Insight achieved the expected standard in reading at KS1. Pupils that did not meet the standard are therefore in the lowest 29% nationally, and this can act as a proxy for lowest 20% nationally. Be aware that by selecting all pupils assessed as working towards the expected standard, you are selecting those in the lowest quartile, not the lowest quintile. You could therefore use your discretion and remove from the group those that, say, narrowly missed achieving expected standards with a scaled score of 98-99.
Standardised scores
Many schools use standardised tests from the likes of NFER, Rising Stars, Star and GL. These tests generate standardised scores (not to be confused with scaled scores) by comparing a pupil's raw score to the results of a large, representative, national reference sample. This process is known as norm-referencing.
Unlike scaled scores - which link to national standards - standardised scores indicate a pupil's position in the national population of similar aged pupils and have consistent meaning regardless of test, subject and age. The scores are, therefore, a way of ordering pupil's attainment within a national context and can be directly translated into percentile rank. The table below (the full table is available here) shows the conversion from standardised score to percentile rank for a sample of scores at the lower end of the scale:
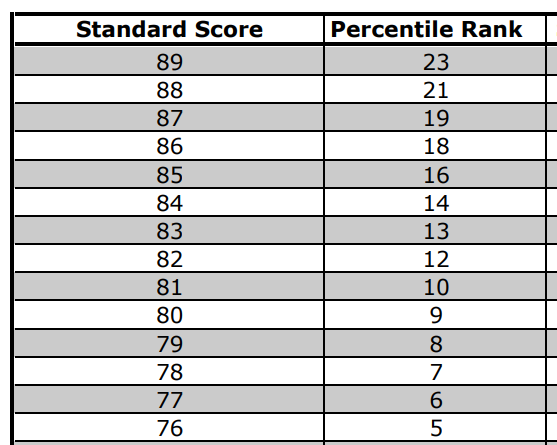
Note that a score of 88 (21st percentile) would not place a pupil in the lowest 20% nationally, whilst a score of 87 (19th percentile) would. We can therefore use a standardised score threshold of 87 or below to identify the relevant pupils.
Setting thresholds in Insight
Insight is highly customisable and schools can define their own thresholds for almost any type of data. If you want to use standardised scores to identify pupils in the lowest 20% nationally, suggested thresholds are as follows:
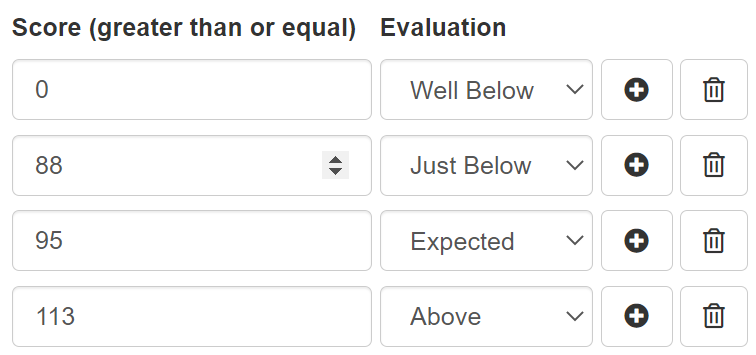
Scores between 0 and 87 - the lowest 20% nationally - will be colour-coded red; scores of 113 or above (the top 20%) will be colour-coded blue. 95 is set to represent the expected standard for reasons explained here.
Please contact Insight support if you would like to change your current thresholds. Note: changes to thresholds will be applied to all assessments that share the relevant mark scheme including historical data.
Identifying pupils in the lowest 20% using Insight reports
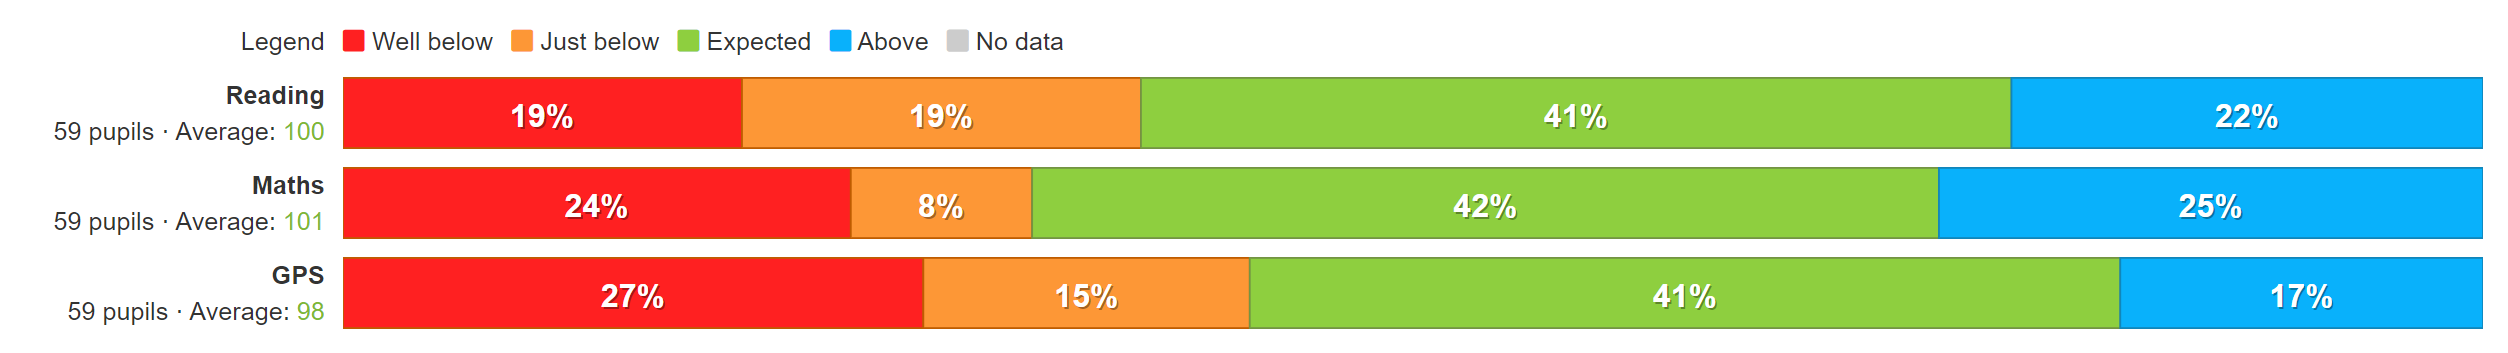
By far the easiest method is to use an Attainment Overview report. This will show pupils in each attainment category and you can click on the portion of each bar to reveal the pupils. The following example is based on standardised scores with the red portion containing those pupils whose scores are below 88 (i.e. the lowest 20%).
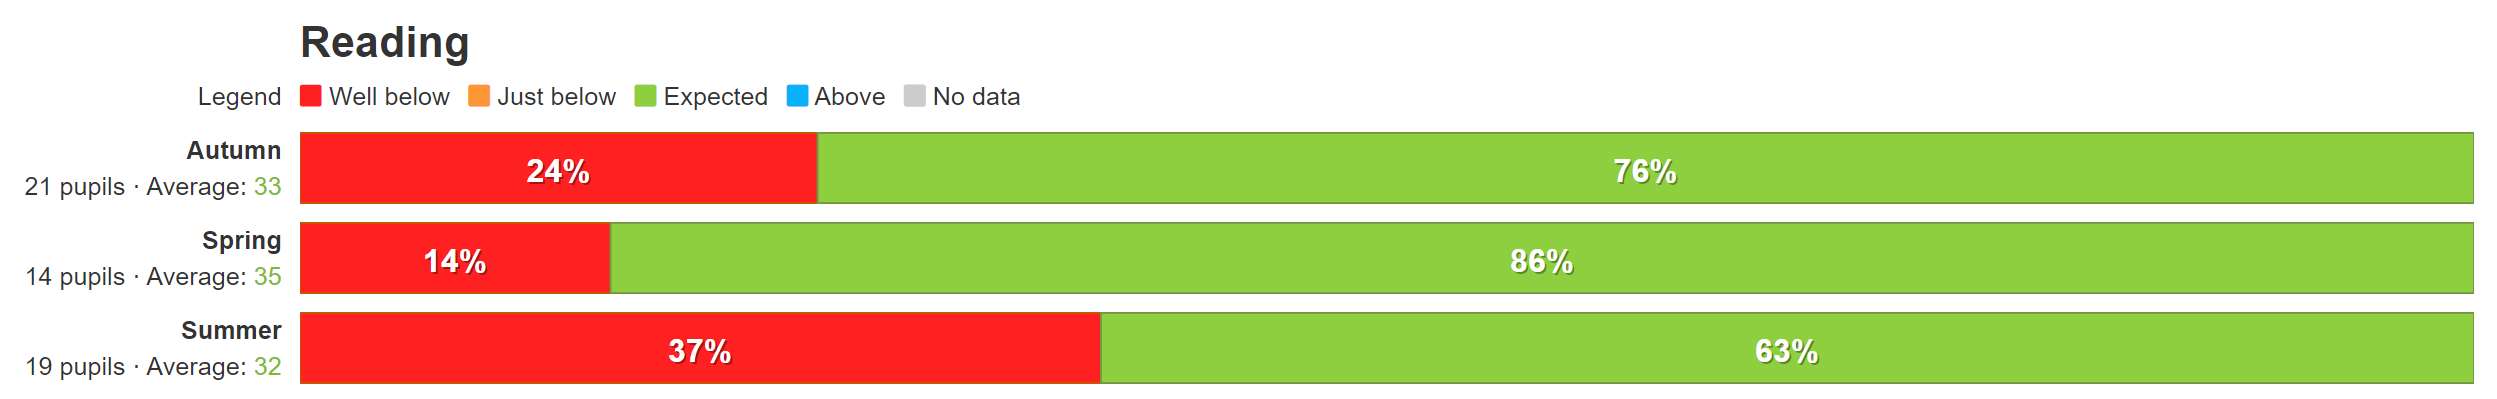
The same can be done for phonics. Here, the red portion contains those that did not meet the standard and, again, you can click on the bars to reveal names:

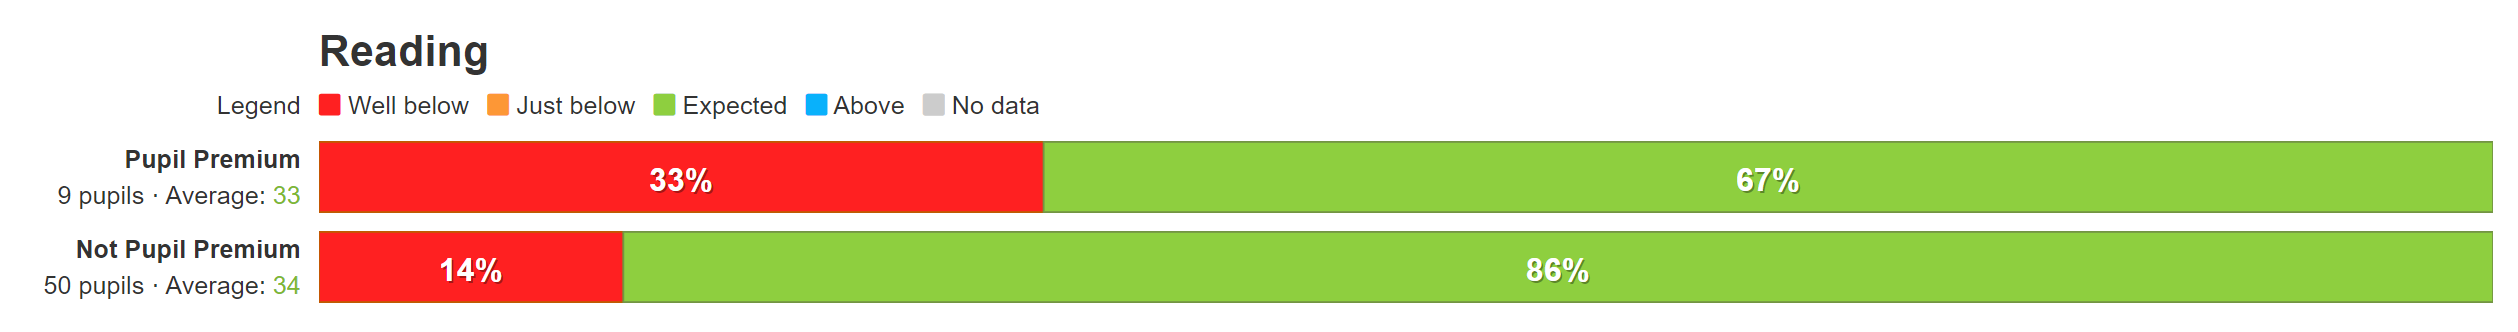
As with all reports, data can be grouped by clicking on the Group Pupils button. Here, the phonics data is separated into Pupil Premium and others:
Grouping by Term of Birth is another important option. This will reveal if it is predominantly those that are younger in the year that make up the lowest 20% group:
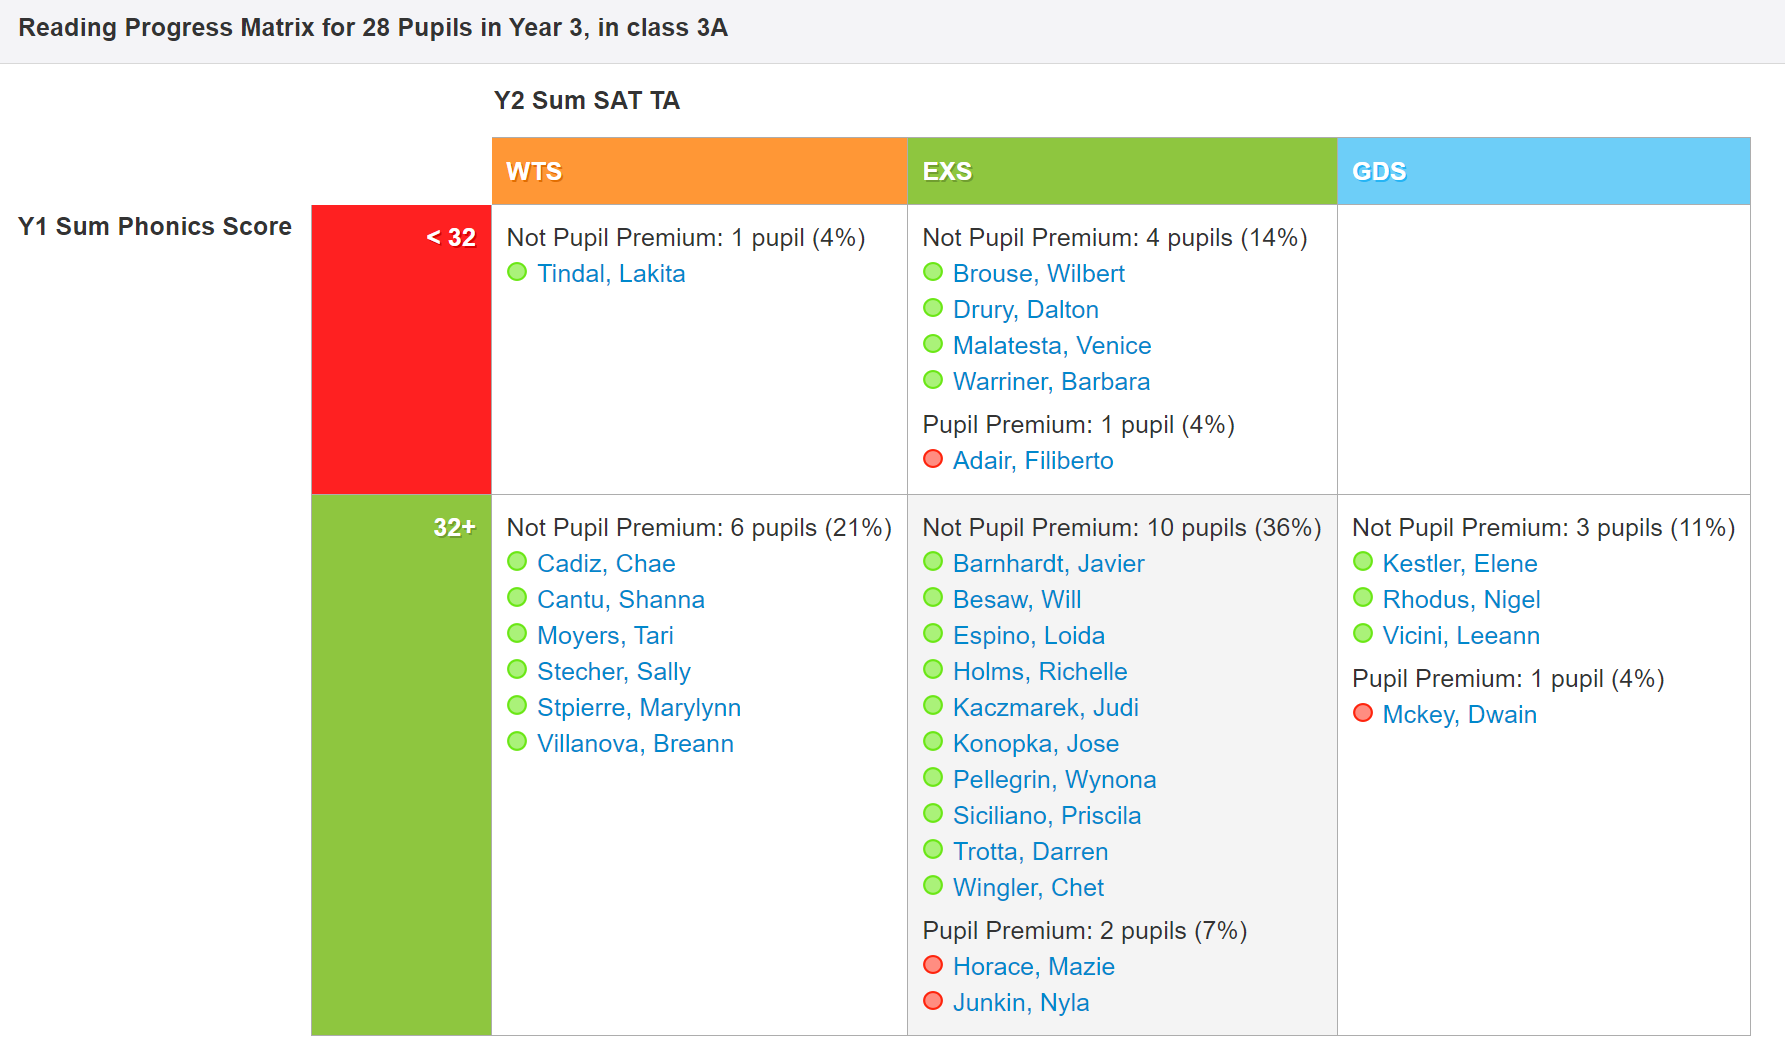
Of course, you can also use a Progress Matrix, which has the added benefit of comparing attainment from different points in time. For example, we can compare phonics outcomes to KS1 results. The following matrix shows that all but one of those that did not meet the phonics standard in year 1 went on to meet expected standards at KS1 a year later. This suggests that pupils are moving out of the lowest quintile:
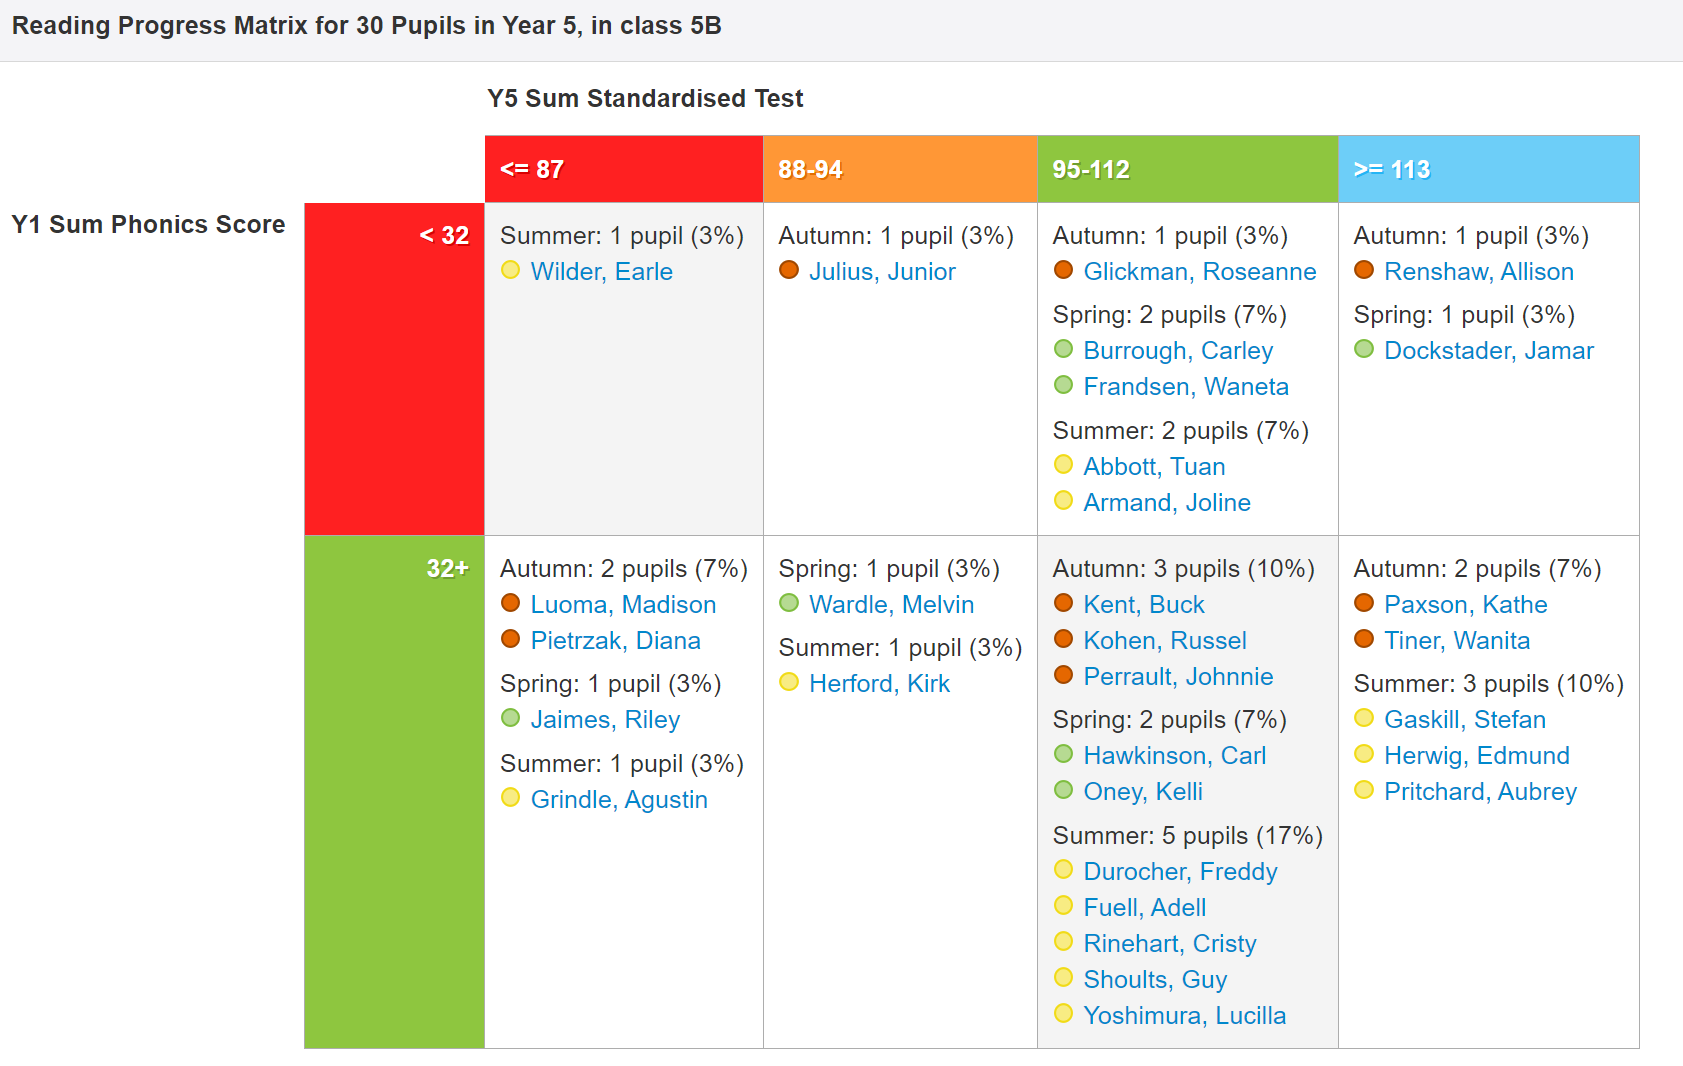
Standardised scores also work in progress matrices. The following matrix compares a year 5 class's year 1 phonics results to their latest standardised scores (with quintile thresholds applied, as described above). Again, just one pupil that did not meet the phonics standard remains in the lowest 20% (i.e. has a score below 88).
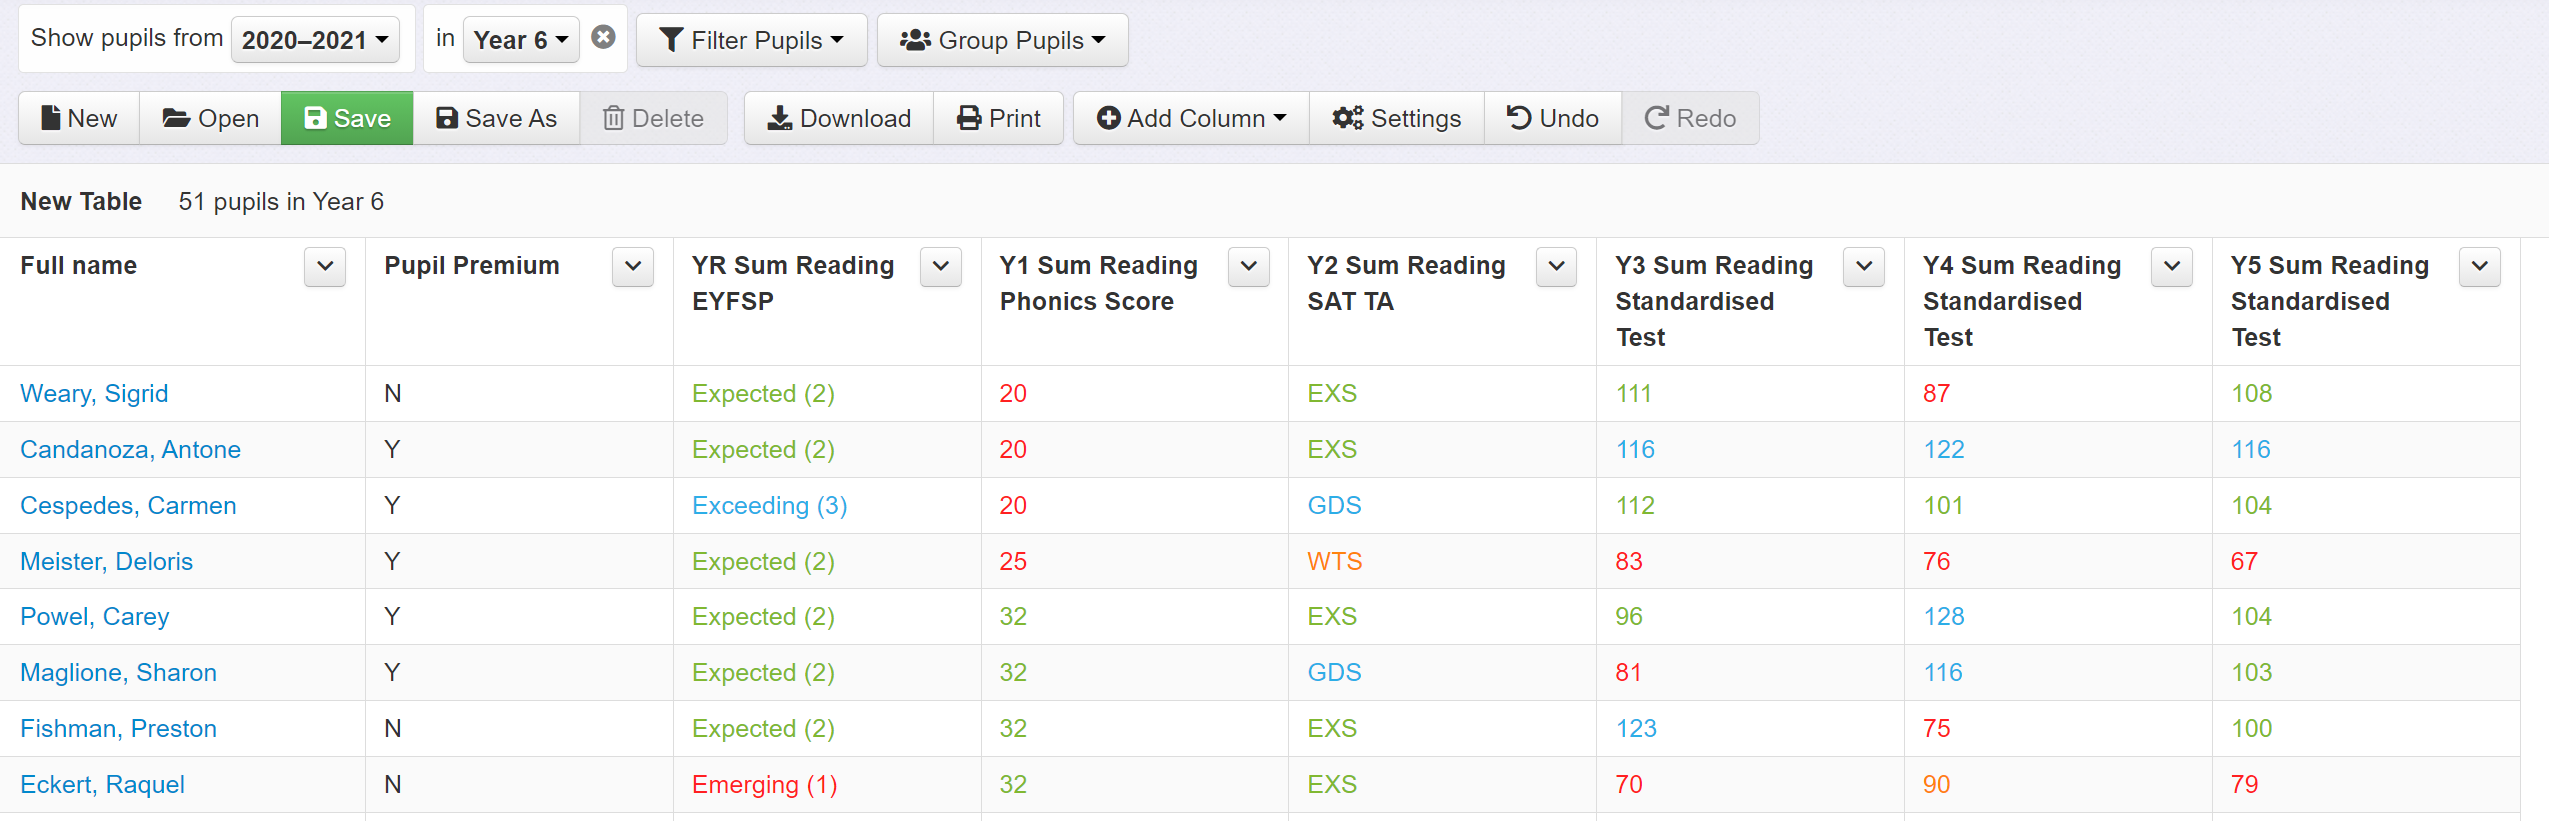
And finally, you can build a table to provide a detailed record of attainment over time. The benefit of a table is that it can contain a huge array of data and can be sorted by the data in any column. The following table contains EYFS, Phonics, and KS1 results alongside recent standardised scores in reading. It is sorted by phonics score in ascending order to allow easy identification of those that were in the lowest 20% at that point. Note: data is taken from a demo and is randomly generated; it is not necessarily consistent.
We hope that this help guide has been helpful. If you need any further information about this topic or anything else, please do get in touch via the help button in Insight.