The difference between standardised and scaled scores
 Updated
Many schools use standardised tests from the likes of NFER, GL, Rising Stars/Hodder and Star Assessment to monitor attainment and progress of pupils, and to predict outcomes. And yet there is lot of confusion about how standardised scores from such tests relate to scaled scores at the end of KS2. The common misconception is that a score of 100 on a standardised test (eg from NFER) is the same as 100 in a KS2 test, but it’s not. Only 50% achieve 100 or more in a standardised test (100 represents the average, or the 50th percentile), yet 73% achieved 100+ in the KS2 reading test in 2019 (the average score in 2019 KS2 reading test was 104). It is not possible for 73% of pupils to achieve a score of 100+ on an NFER (or other standardised) test because a score of 100 on such tests always represents the average. There is therefore a big difference between standardised and scaled scores.
The difference arises from the way the two types of scores are referenced. Standardised tests are norm referenced: they are normally distributed across a bell curve, which is centred on 100. KS2 tests, on the other hand are criterion referenced: the value of 100 is linked to criteria. Pupils that meet those criteria achieve the expected standard and there is no quota on how many can do this. The scores, whilst looking remarkably similar, are actually very different.
The following graphs show the difference in the distribution of scores from the two types of test and suggests how the expected standard at KS2 might translate into a standardised score on the basis of the percentage of pupils achieving it.
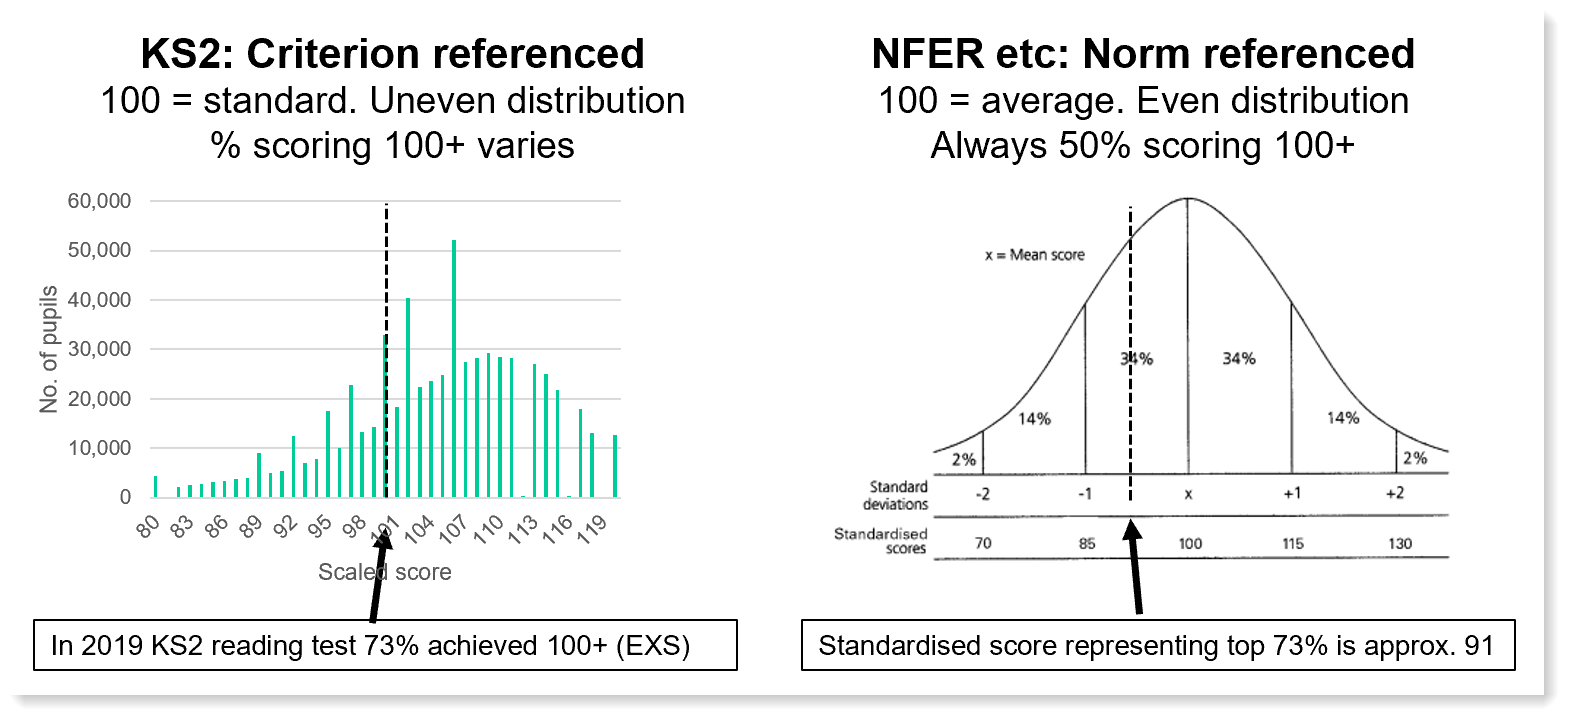
By using a standardised score of 100 as an indicator of expected standards we need to be aware that we are only counting pupils in the top 50% nationally and are therefore most likely underestimating numbers. If we want a standardised score threshold that better approximates expected standards we need one that captures more pupils i.e. a lower score. We could set our threshold at 91, which would identify those in the top 73% nationally (which would match the 2019 pass mark for reading at KS2 - see above) but this is low and risky as it would include borderline pupils. This is why Insight has a default threshold set at 95, which captures pupils in the top 63% nationally. One would expect that such pupils will have a good chance of achieving expected standards – i.e. getting into the top three quarters – at the end of KS2.
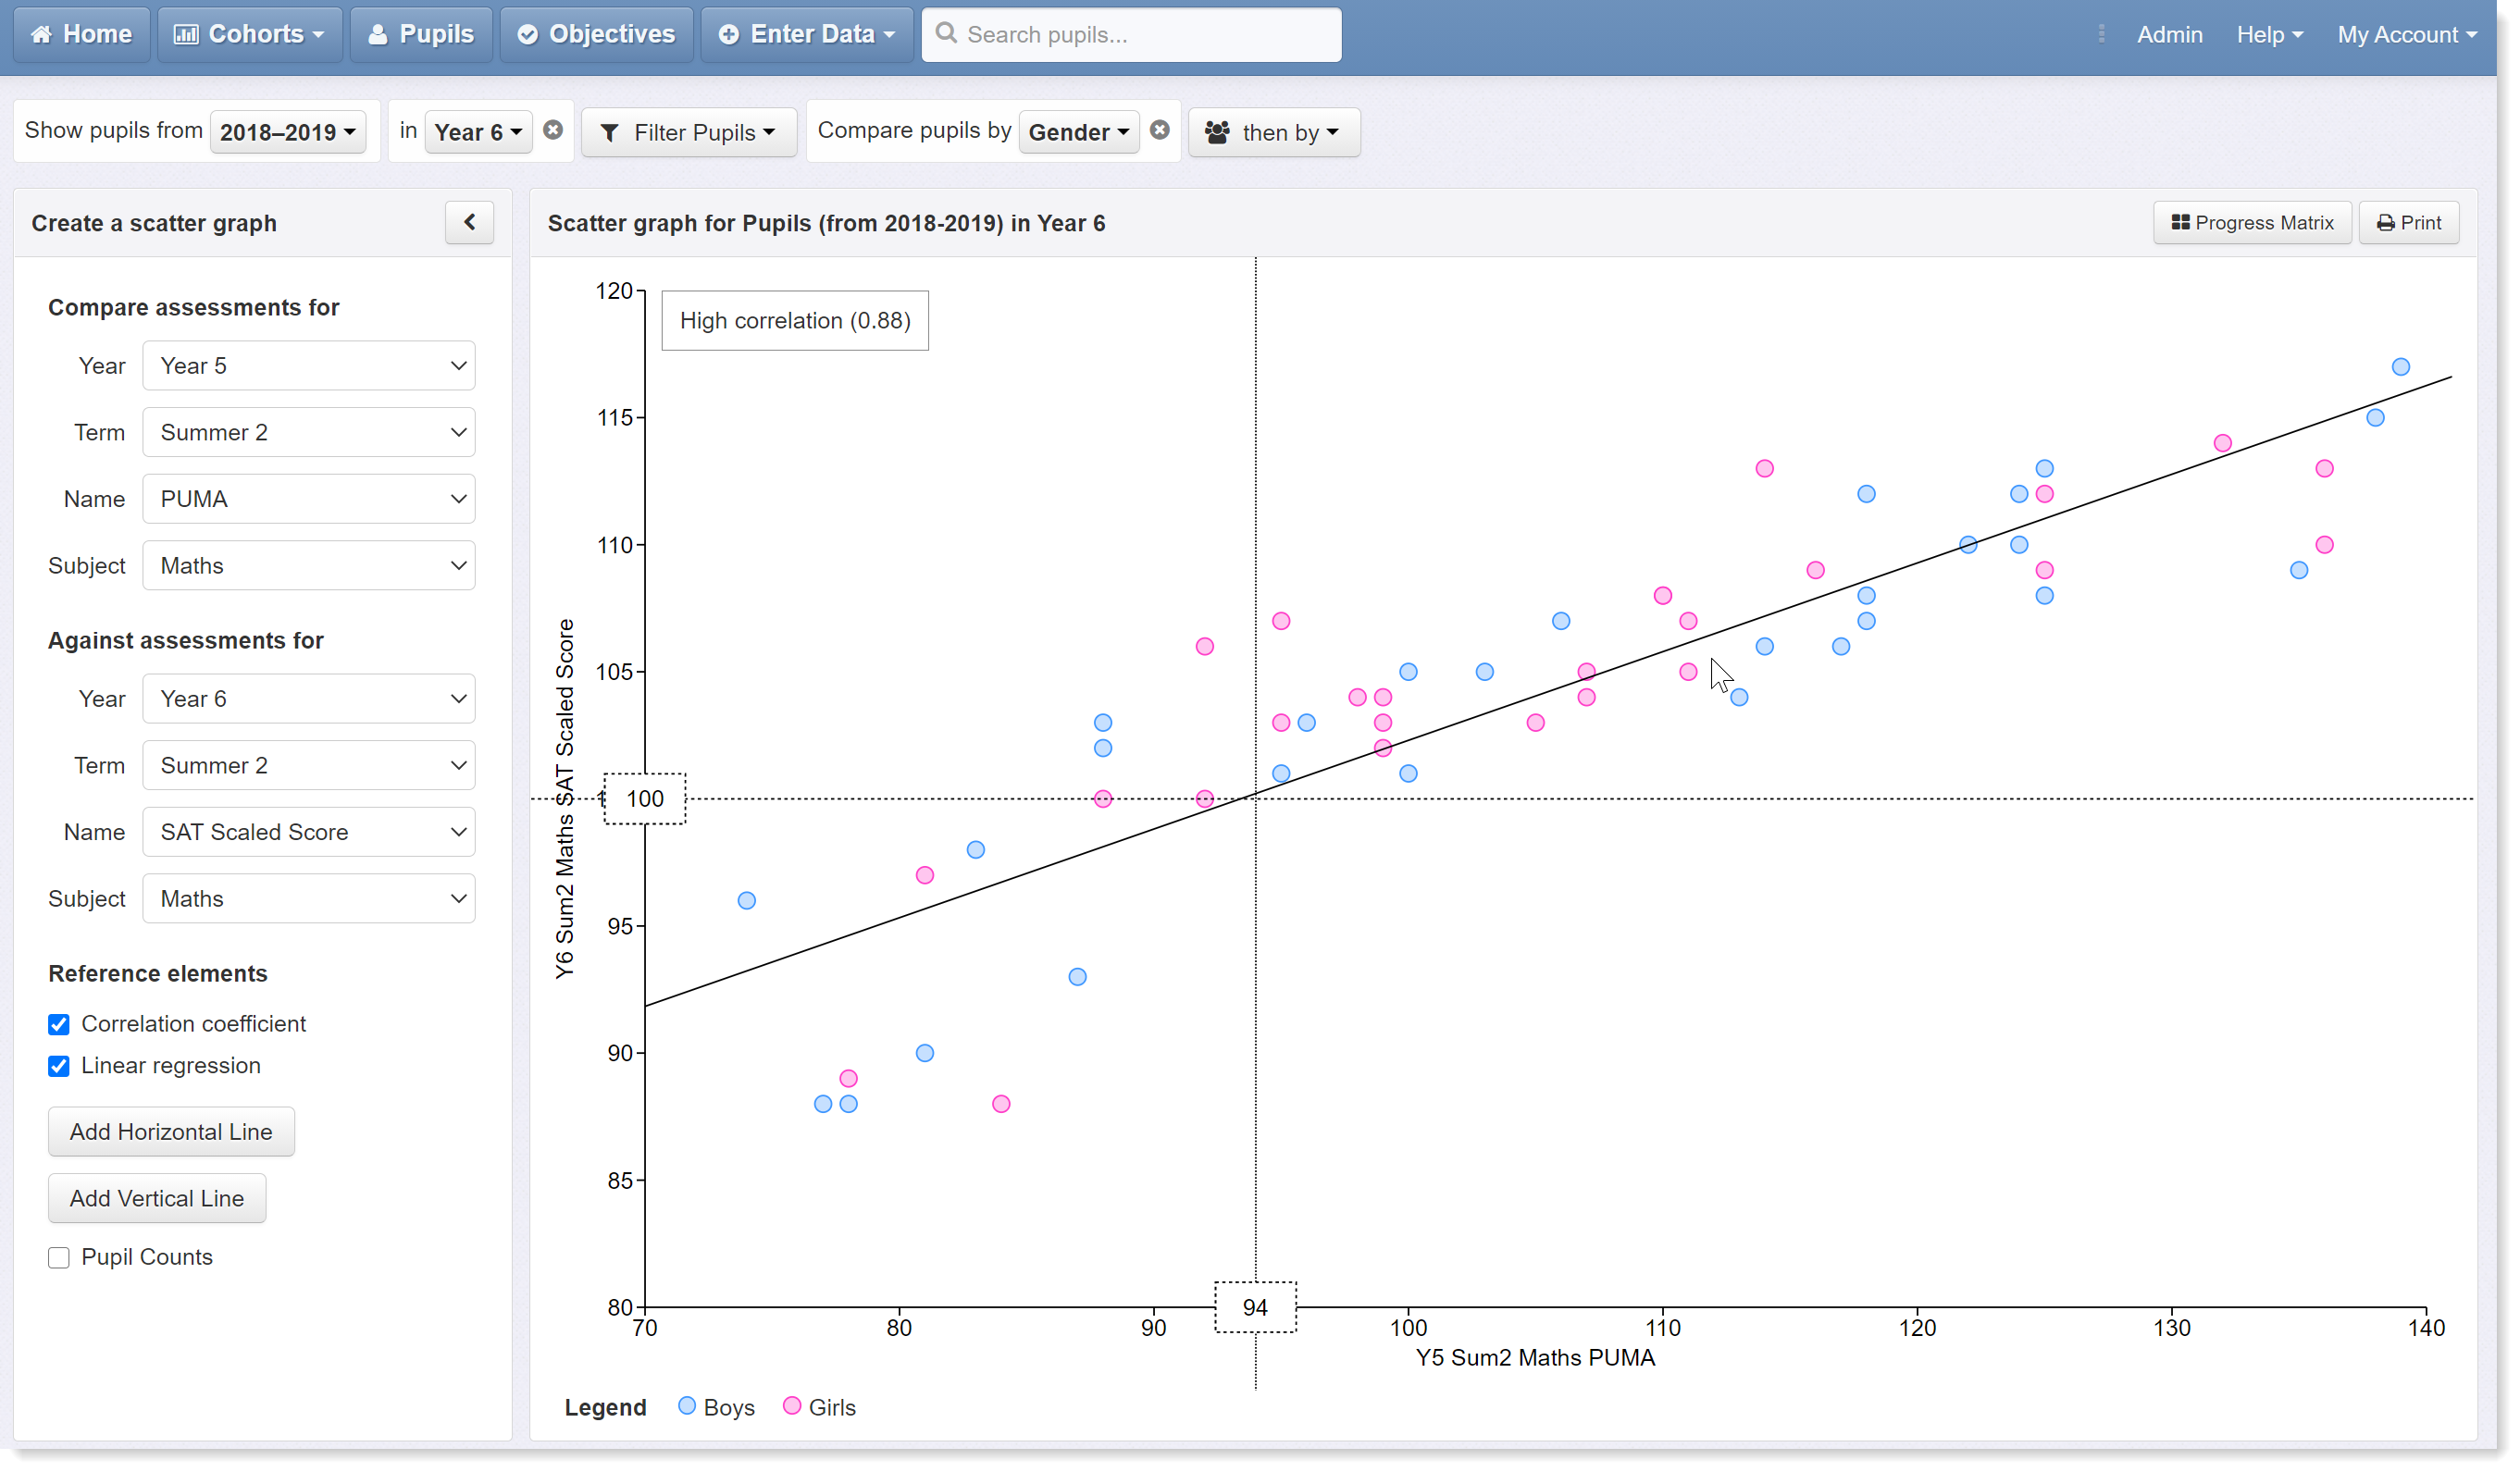
Insight has recently introduced scatter graphs, which can help visualise the relationship between different sets of scores. In the following example, pupils Y5 PUMA standardised scores are plotted against their final Y6 KS2 maths scaled scores. The correlation is high (0.88) and the regression line shows how scores on the earlier test might translate at KS2; and could be used to predict KS2 results from the same test series. The horizontal reference line is set at a scaled score of 100 (i.e. expected standard) and the vertical line has been dragged back until the three lines intersect. This corresponds to a standardised score of 94, which happens to be the score that Rising Stars recommend as a proxy for expected standards. In other words, pupils that achieve a standardised score of 94 have a high chance of going on to achieve expected standards at KS2.
It is therefore important to note that standardised scores are not the same as scaled scores and that there is no parity between the two data sets, which makes translation problematic. Furthermore, it is worth investigating the correlation between standardised scores and KS2 results before attempting to use the former as a predictor of the latter.