How we set the default standardised score thresholds in Insight
 Updated
As explained in this help guide, standardised scores derived from commercially available, optional tests - those from NFER, Rising Stars, Star, GL and the like - are not the same as the scaled scores generated by end of key stage tests. The two systems are not in parity and they are therefore not directly comparable. This presents a problem when trying to use the former to predict the latter.
Our best option for translation is to use percentiles because both sets of scores have common, percentile values. The DfE Statistics website provides detailed tables that show the distribution of scaled scores and these give us the percentile value of each scale point. To better understand the relationship between percentile rank and standardised score, this table is an excellent resource. Once we have the percentile values of both scaled and standardised scores, we can convert one to the other; and this blog post, which includes a lookup table for 2019 KS2 scaled scores, describes the method in more detail.
In Insight, by default we apply set of thresholds to evaluate - colour code - standardised scores based on the percentile relationship outlined above. Those default thresholds are as follows:
- <85: Working below expectations
- 85-94: Working towards expectations
- 95-115: working within expectations
- >115: working above expectations
A standardised score of 85 represents one standard deviation from the mean and the bottom 16% nationally. We feel that pupils with scores below this threshold have a high probability of not achieving expected standards. It is probably more useful to have a threshold that identifies those that are unlikely to achieve expected standard than it is to have a lower threshold that just identifies those that are pre-key stage.
Pupils achieving scores between 85 and 94 are the borderline group i.e. a mix of those that could achieve expected standards but probably won't, statistically speaking; and those that probably will but still have quite a high chance of falling short.
A score of 95 represents the 37th percentile. In other words, it captures those in the top 63% nationally, and we feel that these pupils have a very strong chance of achieving expected standards considering it's around the top 75% nationally that do so (in 2019 KS2 tests, 73% achieved EXS in reading and 97% did so in maths).
And finally, the scores higher than 115 are categorised as above expectations. This is the mirror of 85 on the bell curve, representing one standard deviation above the mean and the top 16% nationally. Pupils achieving such scores are highly likely to achieve high scores at key stage 2 where approximately a quarter do so (a third in GPS).
These thresholds - 85, 95, 115 - are set deliberately high so as to avoid including borderline pupils. We feel that it is better to err on the side of caution and place those pupils in a lower group.
Of course, these are default thresholds and the great thing about Insight is that you can define your own, not just for standardised scores but for other types of data, too. You can even set variable thresholds for practice SATS that increase across the year. Understandably, schools will want to adapt those thresholds and it's important that we provide that facility. The advised thresholds for PUMA and PIRA tests are a case in point.
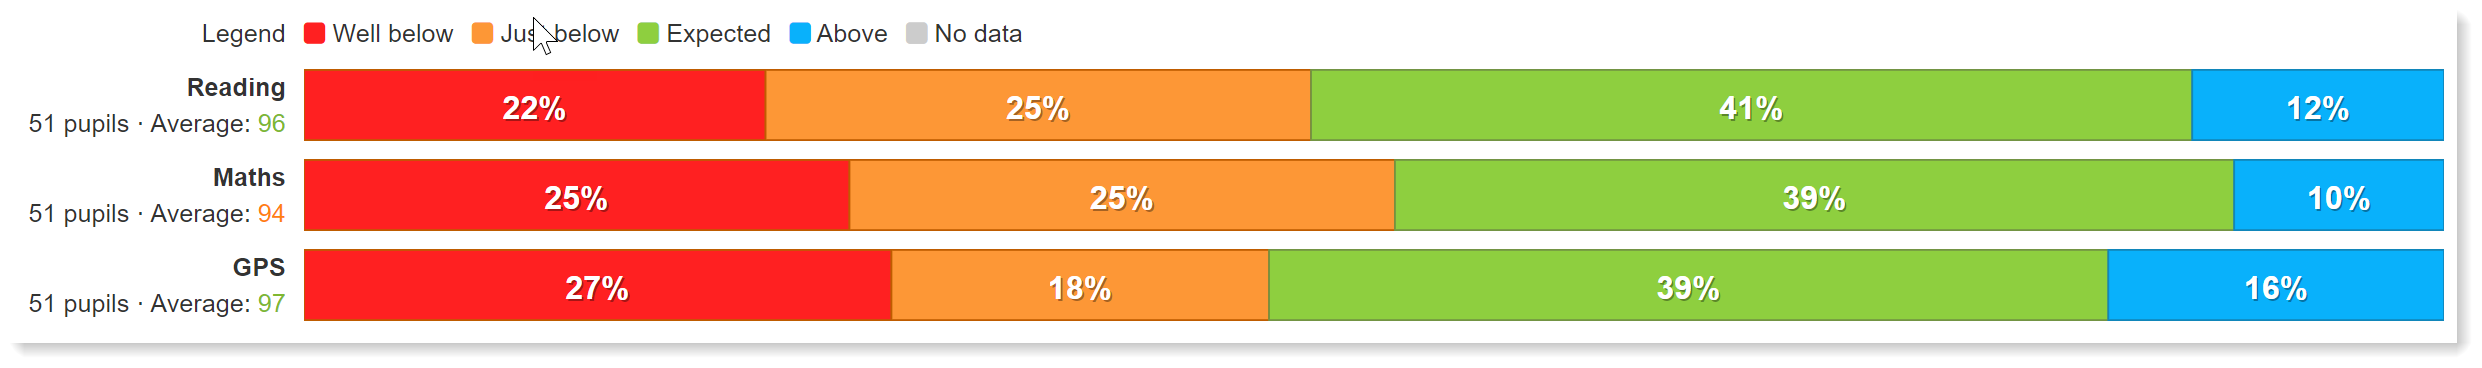
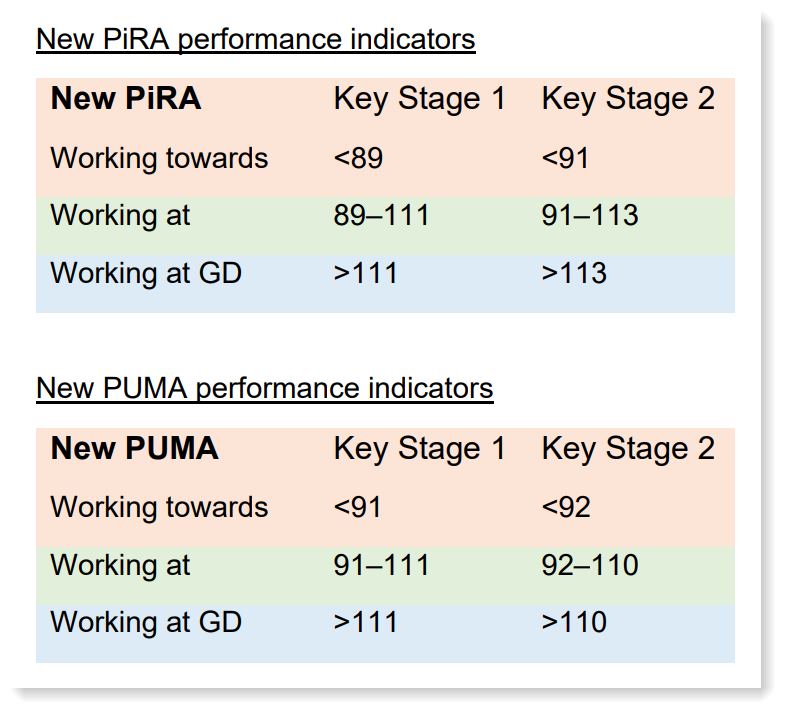
Every year, Rising Stars publish thresholds to help make sense of PUMA and PIRA test results. These thresholds group the standardised scores together and relate them to key stage outcomes - working towards, working at, working at greater depth - much as we do in Insight. The most recent published set of thresholds are as follows:
These are established via a rigorous process, which involves comparing results of PUMA and PIRA tests with the results at KS2. We have already set these thresholds for several schools and can easily apply them to your Insight profile if required, but there are a couple of points to consider first:
- There is no 'below' band, which means that a large and diverse group may be identified as 'working towards'. It is worth having a lower band to differentiate those that are highly unlikely to achieve expected standards from those that will be borderline. A low threshold of 70 (bottom 2% nationally) probably aligns with the pre-key stage, but consider setting it higher so it identifies the wider 'below' group including those that will sit tests but are highly unlikely to achieve standards.
- The lower limits of the 'working at' bands are perhaps a bit too low. Scores of 91 and 92 recommended for PiRA and PUMA - to help predict expected standards at KS2 - represent the top 73% and 70% nationally respectively. In the case of reading, this exactly matches the percentage of pupils that achieved expected standards at KS2 in 2019. This may result in a number of 'at risk' pupils identified as working at.
We are happy to set any thresholds you like for the data you store in Insight, including those listed in the table above, but make sure the system is set up to give you the information you need.
The golden rule is: make Insight work for you.
Get in touch if you want us to set up new thresholds or edit existing ones.
support@insighttracking.com