Explaining discrepancies between pupil and school level FFT estimates
 Updated
FFT provide schools with a number of estimates of future performance, the main ones being pupil estimates in each subject and school level summary estimate for the whole cohort. These estimates are derived from the national average results in previous years of pupils and schools with similar KS1 prior attainment. Whilst they are no longer fully contextualised, they do take into account gender and month of birth and are adjusted accordingly. As such, you may see two pupils with the same KS1 results that have differing estimates for KS2.
Cohort level estimates in FFT are presented like this:
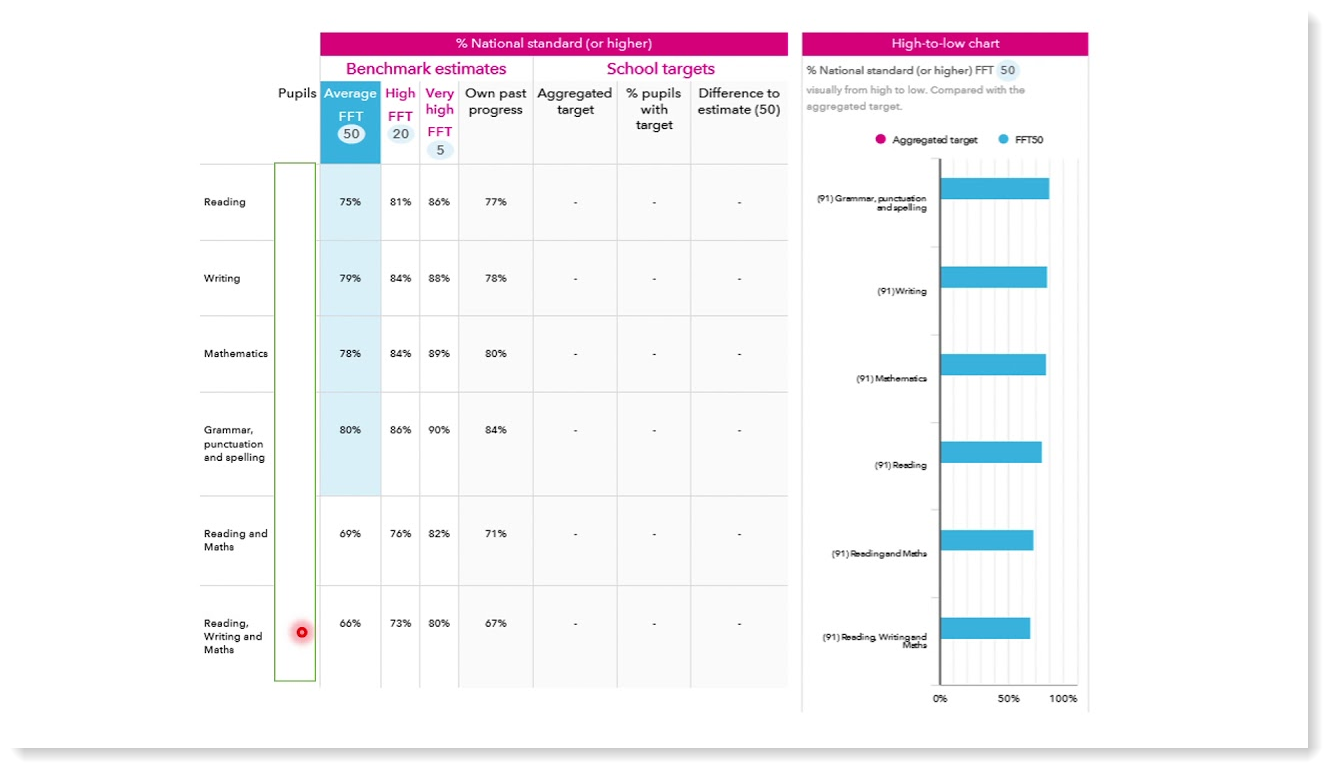
There are four columns of data presented in the table:
- FFT50: based on the cohort's prior attainment at KS1, this is an estimate of the results you might expect in a median (50th percentile) ranked school. This is the average estimate.
- FFT20: based on the cohort's prior attainment at KS1, this is an estimate of the results you might expect in a top 20% ranked school. This is a high estimate.
- FFT5: based on the cohort's prior attainment at KS1, this is an estimate of the results you might expect in a top 5% ranked school. This is a very high estimate.
- Own Past Progress: This is a prediction of results based on your school's past performance
Pupil level estimates in FFT are presented as follows:
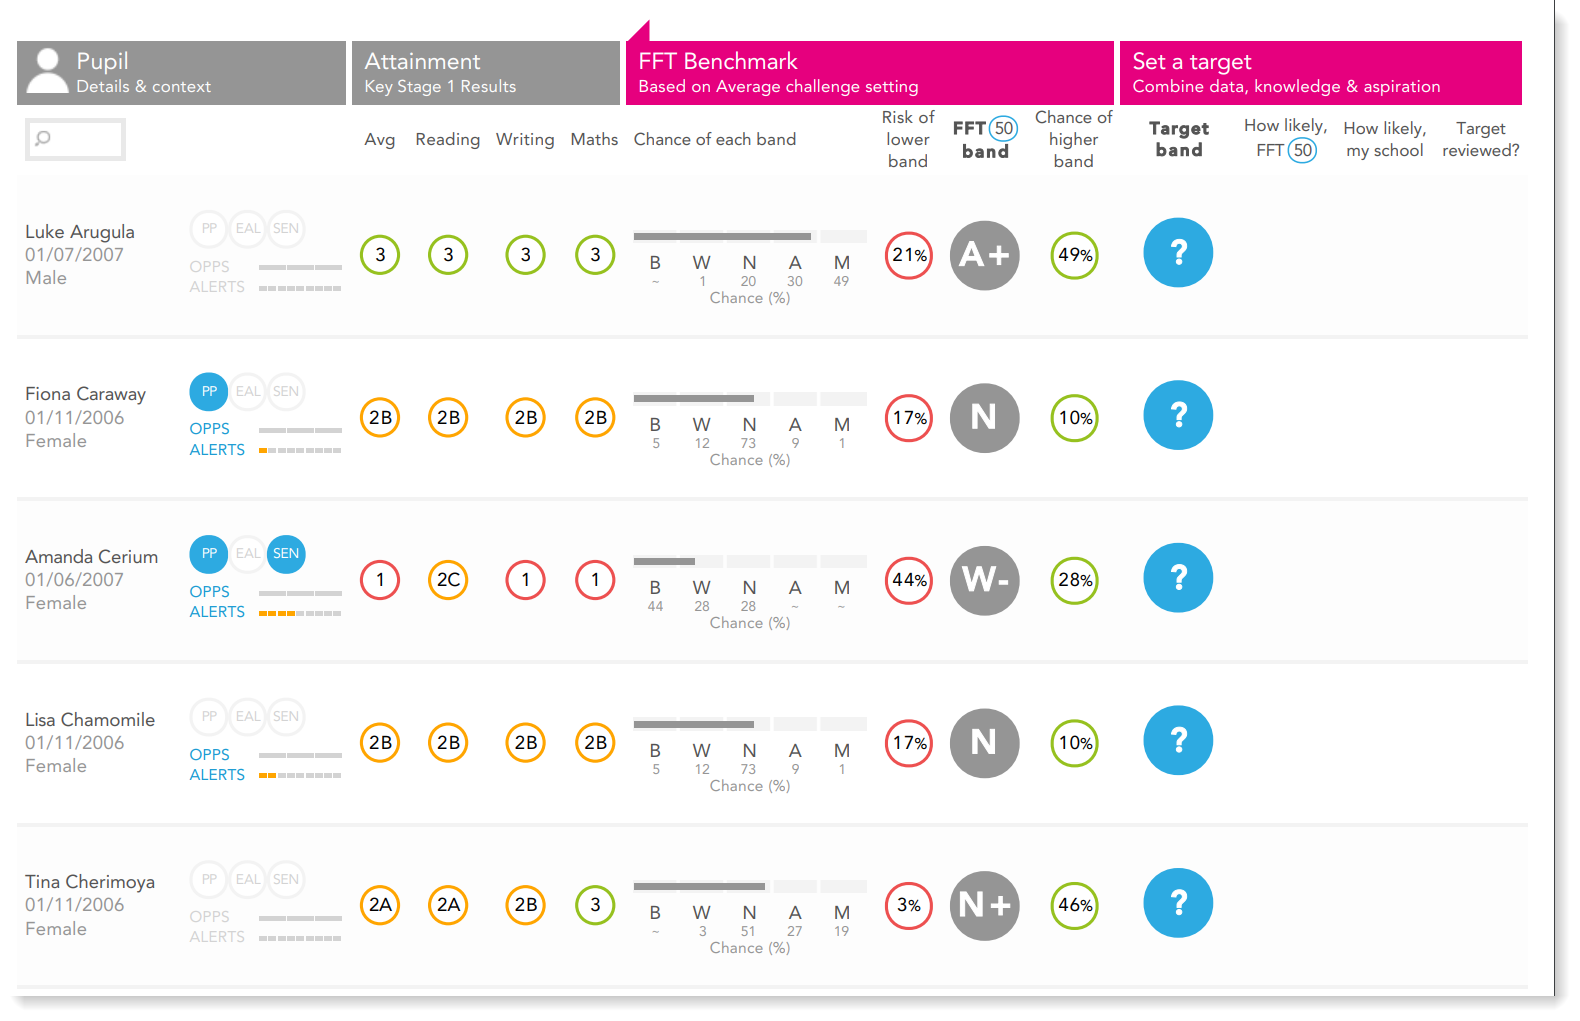
Note the percentage chance of the higher/lower band. The band in the grey circle indicates the most likely outcome based on the pupil's prior attainment but those with at risk of falling into a lower band have a - added to their estimate, and those with a reasonable chance of achieving the higher band will receive a +. You can select the level of challenge (50/20/5) to discover the chance of pupils achieving certain outcomes in hypothetically average, high and very high performing schools.
The pupil vs cohort estimate discrepancy
It is reasonable to assume that the cohort level estimate in first table is the sum of the pupil level estimates in the second table. That by adding up all the pupils with an 'N' estimate or higher and dividing he sum by the total number of pupils, the result will equal the cohort-level estimate. Unfortunately this is not the case, and this causes confusion, especially if schools have imported estimates into their tracking systems, which then aggregate them in summary reports.
The reason for this discrepancy is down to the way the estimates are calculated. The methodology for calculating cohort level estimates differs from that used to calculate pupil estimates. One is not the sum of the other.
Calculating cohort level estimates
FFT group schools by the prior attainment of past cohorts and then rank them according to their results. For example, we could group schools on the basis of the KS1 prior attainment of 2019 KS2 cohort, and then rank each group by their KS2 results. The FFT50 estimate for your school is simply the average result of schools with similar prior attainment to yours. This will be the result of the median ranked school - the school in the middle of pile. The FFT20 estimate is the result of the school at the 80th percentile (FFT refer to this as the 20th percentile), and FFT5 represents the result of the school at the 95th percentile (or 5th percentile in FFT terms).
It is important to note that the estimate is not adjusted to take account of the size of the cohort. This means that a cohort of 20 pupils, where each pupil is 'worth' 5% of the total, could have an FFT50 estimate of 72%, which is not possible to achieve. This is simply the unadjusted result of median ranked school in your group. A figure of 70% or 75% would be more logical.
Calculating pupil level estimates
Again, the calculation involves prior attainment but the process is different. FFT take historical data and group pupils by prior attainment. They then calculate the percentage of pupils in each prior attainment group that achieved at least the expected standard, or achieved a high score (greater depth). These prior attainment groups are further refined by factoring in gender and month of birth in order to make estimates more realistic. Pupils in prior attainment groups that have historically seen more than 50% achieve the expected standard (i.e. that have a greater than 50% chance) will receive an 'N' (national standard) estimate, which may be accompanied by - or + to indicate risk (close to 50/50 chance) or opportunity (reasonable chance of the higher band). Pupils that have a less than 50% chance of achieving expected standards will be assigned a 'W' (working towards) estimate, and those with a greater than 50% chance of achieving a high score/greater depth will be placed into the A (above) band.
The problem here is that any pupil with a greater than 50% chance of achieving expected standards is effectively counted in the 'yes' pile, even where the probability is close to 50/50 and this inflates the estimate. Adding up all the pupils with an N estimate or higher will often result in an aggregated percentage that is higher - sometimes much higher - than the summary estimate, which is probably more realistic. Removing pupils with N- estimates from the 'yes' pile is more prudent but is still likely to result in a percentage that exceeds the summary estimate. When using FFT estimates, we therefore need to pay attention to the percentage chance as well as the band. And if we intend to present these data to audiences such as governors, it is best to share the summary FFT50 estimate rather than the aggregated pupil level data, which will include more borderline pupils.
Also bear in mind that estimates for current KS2 cohorts are problematic because they do not have levels at KS1. No cohorts with the new national curriculum KS1 results, on which the estimates are based, have reached the end of KS2 yet (that should have happened in 2020 but didn't due to the Covid lockdown), which makes estimating outcomes extremely risky. Best to treat current estimates with caution until we have at least one year's data in the bank.