Understanding Venn diagrams in the Attainment Overview report
 Updated
Venn diagrams show how attainment overlaps across two or three assessments. For example, you can see which pupils are meeting expectations in Reading, Writing and Maths together, and which are meeting expectations in only some of these subjects.
Where do I find the Venn diagrams?
- Open Reports > Overviews – Attainment
- Use Filter Pupils to choose the pupils you want to include
- On the Assessments tab, select two or three subjects and choose the assessment name, academic year and term
- If you only want to only show Venn diagrams (hiding the shaded attainment bars) on the Settings tab, check that Display is set to combined attainment only
Venn diagrams appear when you select two or three assessments.
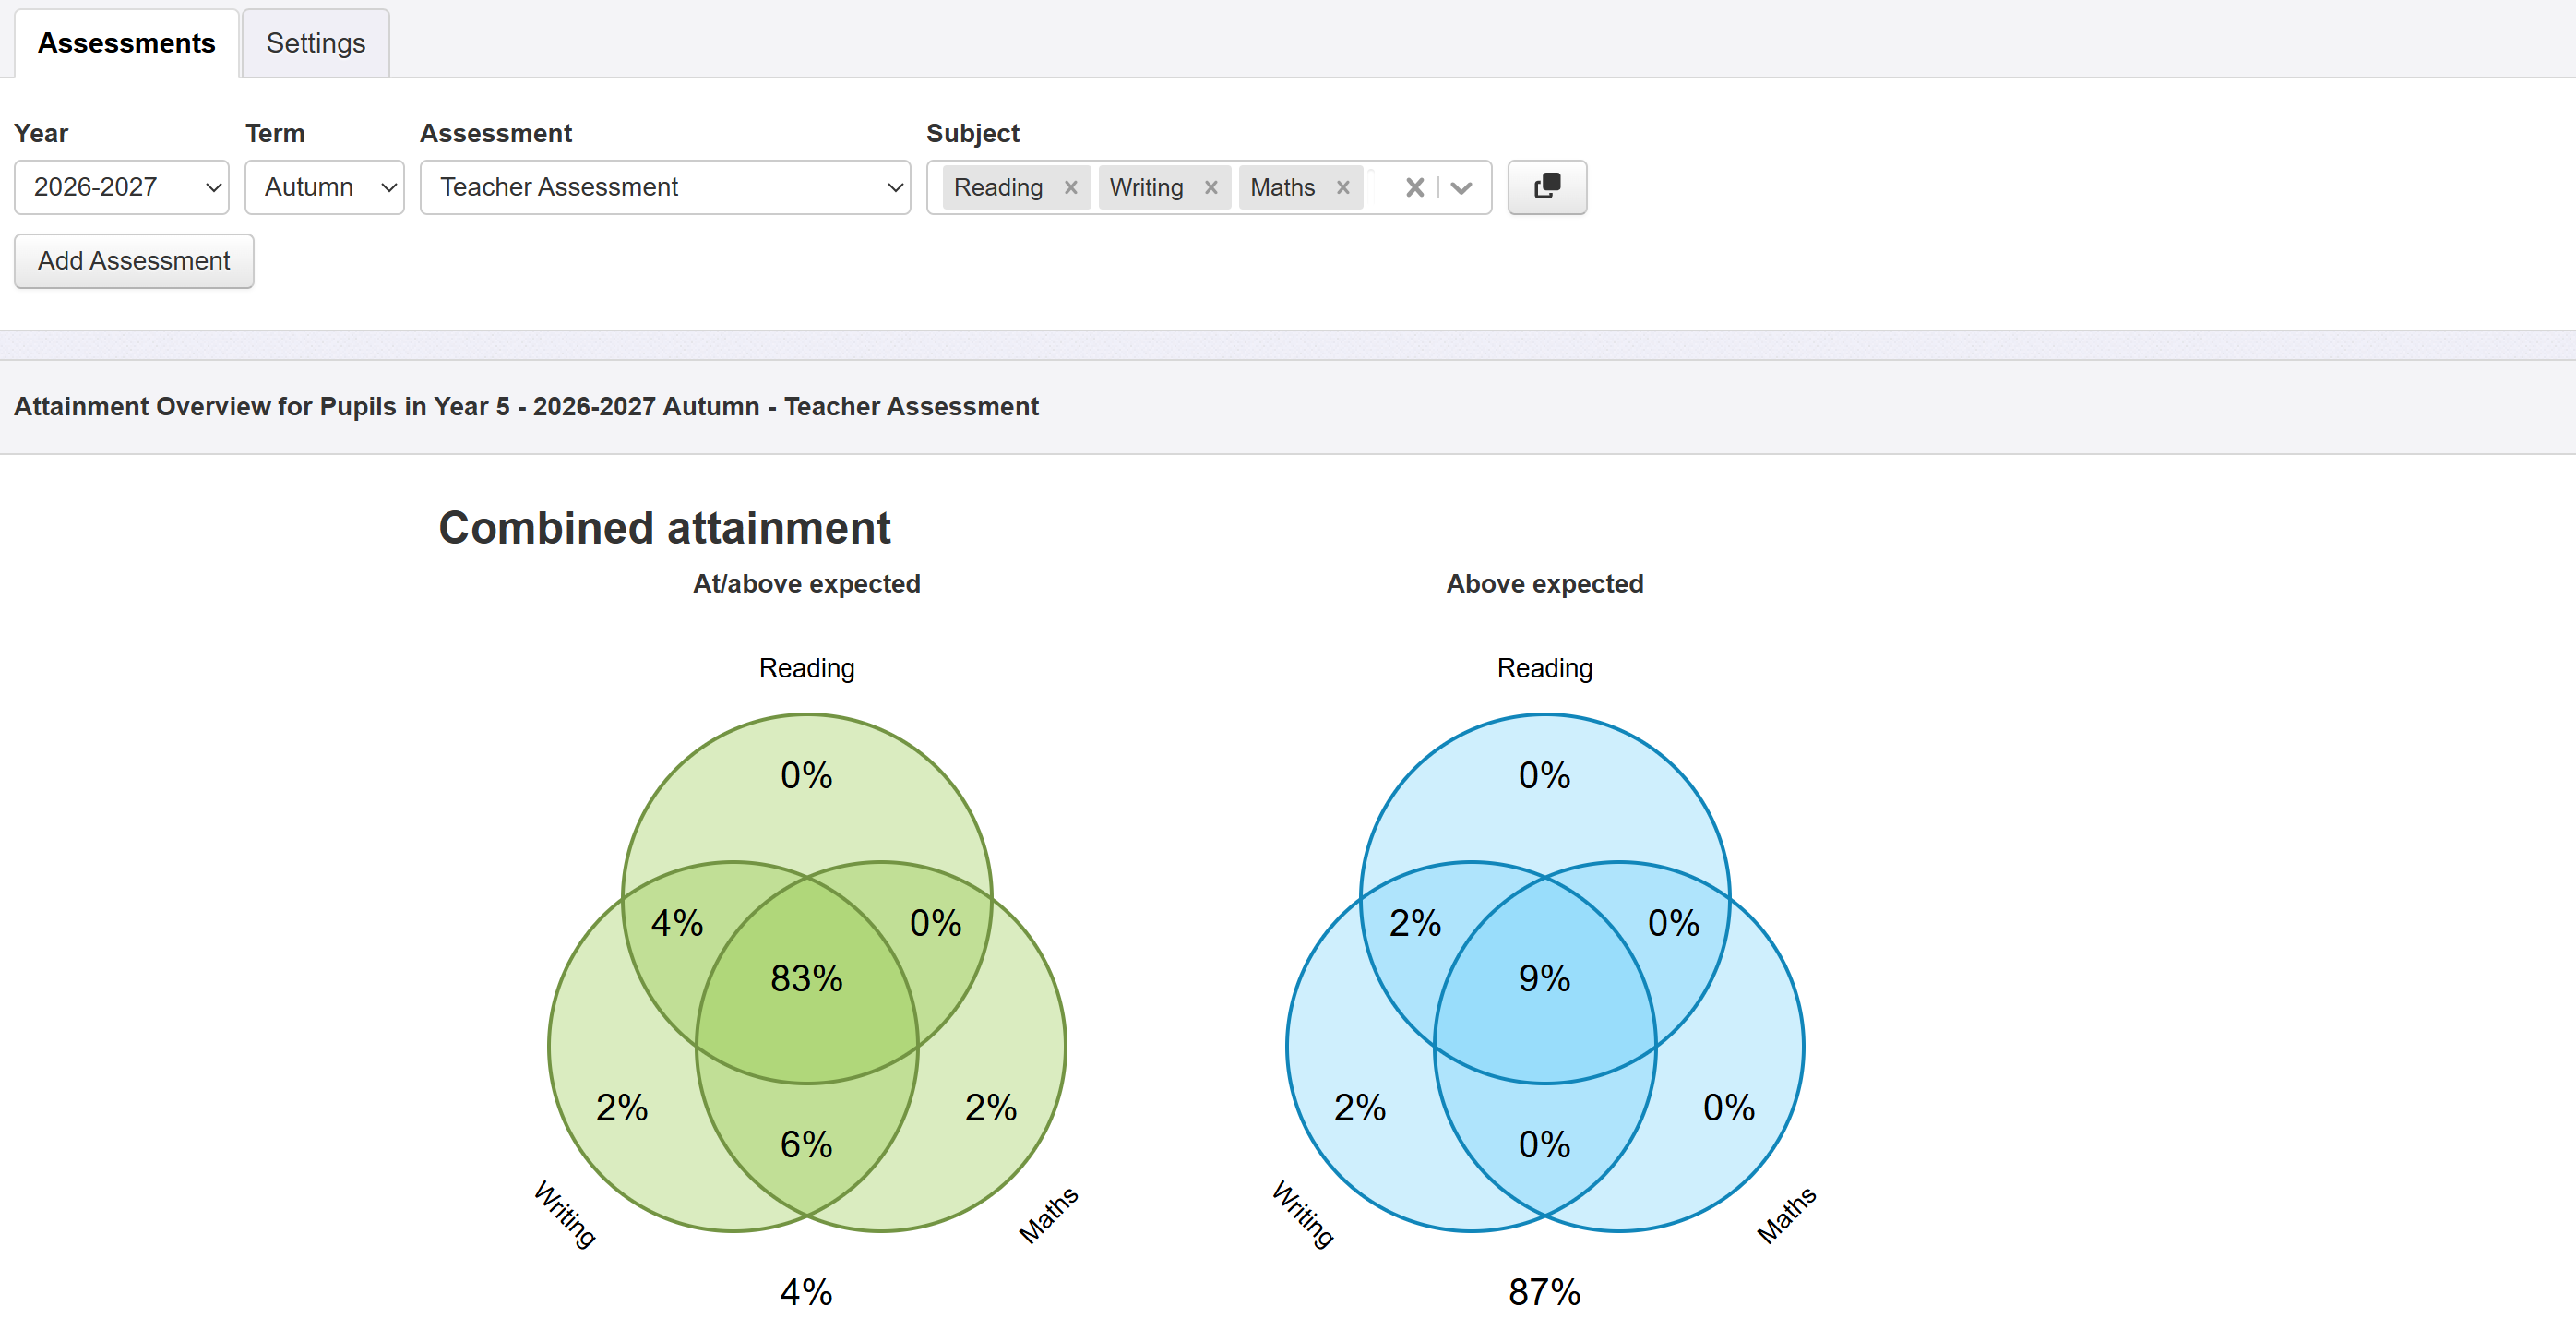
What does each circle represent?
Each circle represents one of the selected assessments. The labels around the diagram identify them.
Check the heading above each diagram to see what it measures:
- At/above expected includes pupils assessed as Expected or Above.
- Above expected includes pupils assessed as Above only.
A pupil can therefore appear in a different section of each diagram.
What do the different sections mean?
Each pupil belongs to one section of a diagram, depending on which assessments they meet the threshold in.
For a diagram comparing Reading, Writing and Maths:
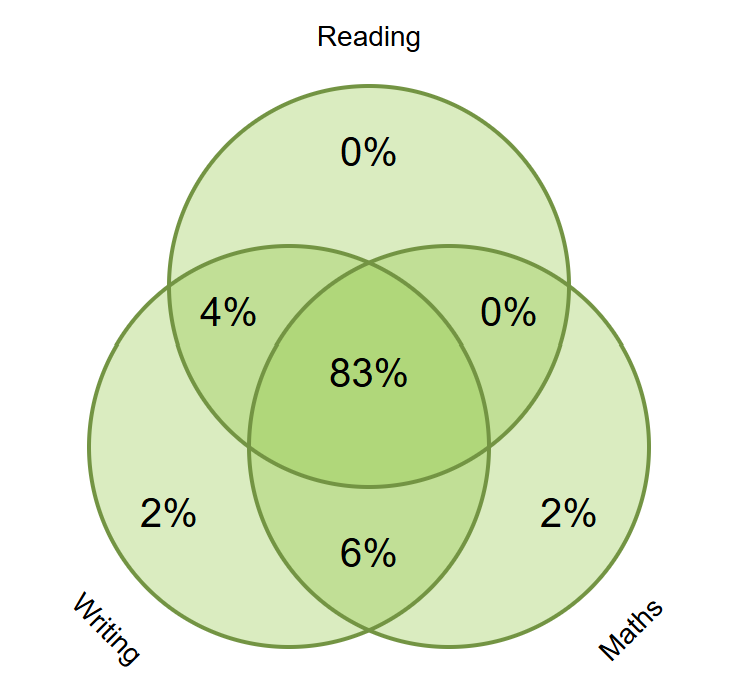
Section | What it means |
Reading circle only | Pupils meet the threshold in Reading, but not Writing or Maths. |
Overlap between Reading and Writing, outside Maths | Pupils meet the threshold in Reading and Writing, but not Maths. |
Centre, where all three circles overlap | Pupils meet the threshold in all three subjects. |
Outside all the circles | Pupils do not meet the threshold in any of the three subjects. |
The same principle applies to the other sections. For a two-circle diagram, the overlap shows pupils meeting the threshold in both assessments.
What does the percentage underneath the Venn diagram mean?
The percentage underneath the diagram represents pupils outside all the circles: those who do not meet that diagram’s threshold in any of the selected assessments.
Its meaning depends on the heading:
- Under At/above expected, these pupils are below expected in every selected assessment.
- Under Above expected, these pupils are not above expected in any selected assessment. They may still be meeting expectations.
For example, 76% underneath an Above expected diagram means that 76% of pupils are not assessed as Above in any of the selected assessments. It does not mean that 76% are below expected.
What does the percentage in the centre mean?
The centre shows pupils meeting the threshold in all selected assessments.
For example, 70% in the centre of an At/above expected diagram for Reading, Writing and Maths means that 70% of pupils are at or above expected in all three subjects.
Is each percentage a percentage of that circle?
No. Each section shows a percentage of the pupils included in that diagram, rather than a percentage of the pupils within an individual circle.
To find the total meeting the threshold in one subject, include every section inside that subject’s circle, including its overlaps.
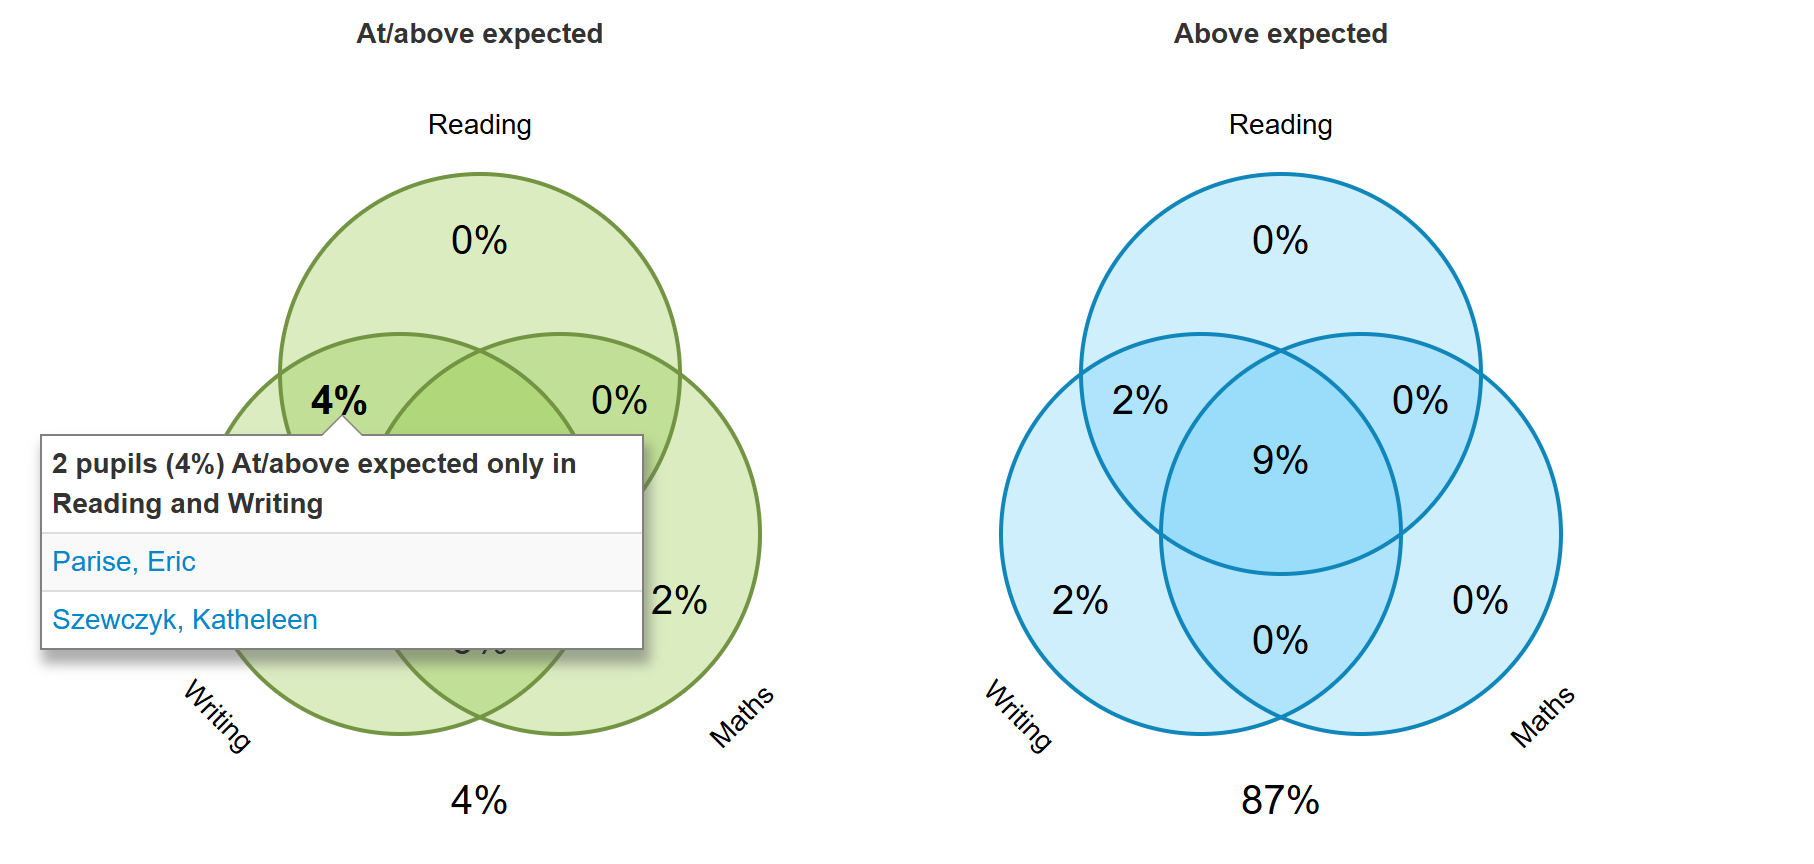
How can I see which pupils are in a section?
Click a section of the Venn diagram to see the pupil names. Click a name to open that pupil’s profile.
You can also tick Show pupil names on the Settings tab to display names within the report.
Can I show pupil numbers instead of percentages?
Yes. On the Settings tab, change Using from percentages to pupil numbers.
Use Group Pupils if you want separate diagrams for groups, such as year groups or boys and girls.
For more about selecting assessments, filtering pupils and adjusting settings, see the Attainment Overview report guide.
Why are Venn diagrams only shown for two or three assessments?
With four or more assessments, the number of possible overlaps makes a Venn diagram difficult to read. Insight uses a table for combined attainment instead, so the results remain clear and easy to interpret.
